At the time of this writing on Monday, the markets are off by more than -1.5%, which would qualify the trading day as an “outlier day.” From time to time, we see outlier days occur in the middle of a bull market. Why? Well, markets fluctuate in a normal manner on low/decreasing volatility. In fact, for most of this year, volatility has been declining. This is similar to the compressing of a spring. When volatility gets low and compressed, it will eventually “pop,” typically down, to relieve some of the pent-up pressure.
The news media will attribute this day to whatever they can. The latest headline I have read relates the market’s single-day drop to rising COVID cases. Did this cause the market to fall? It does not matter. Volatility got compressed and went to relieve pressure. We will continue to monitor the markets for any changes in environment, but most of the time, a day like Monday results in the markets moving back towards normal market behavior.
Market Breadth
In a market update published last week, we wrote about the Advance/Decline Line and market breadth. Here is a short summary of some of those points:
- The Advance/Decline line is flattening out. This means that there is not as much broad participation amongst securities during the market’s recent rise
- Technology is leading the charge. Since Technology-related stocks make up the hefty majority of the market capitalization-weighted S&P 500, it has been carrying the markets higher while other market segments flatten out.
- There is not currently a divergence between the A/D line and the markets. Typically, the formation of a major bear market will occur when the markets are rising, but breadth is falling for an extended period. Thus far, this has not happened.
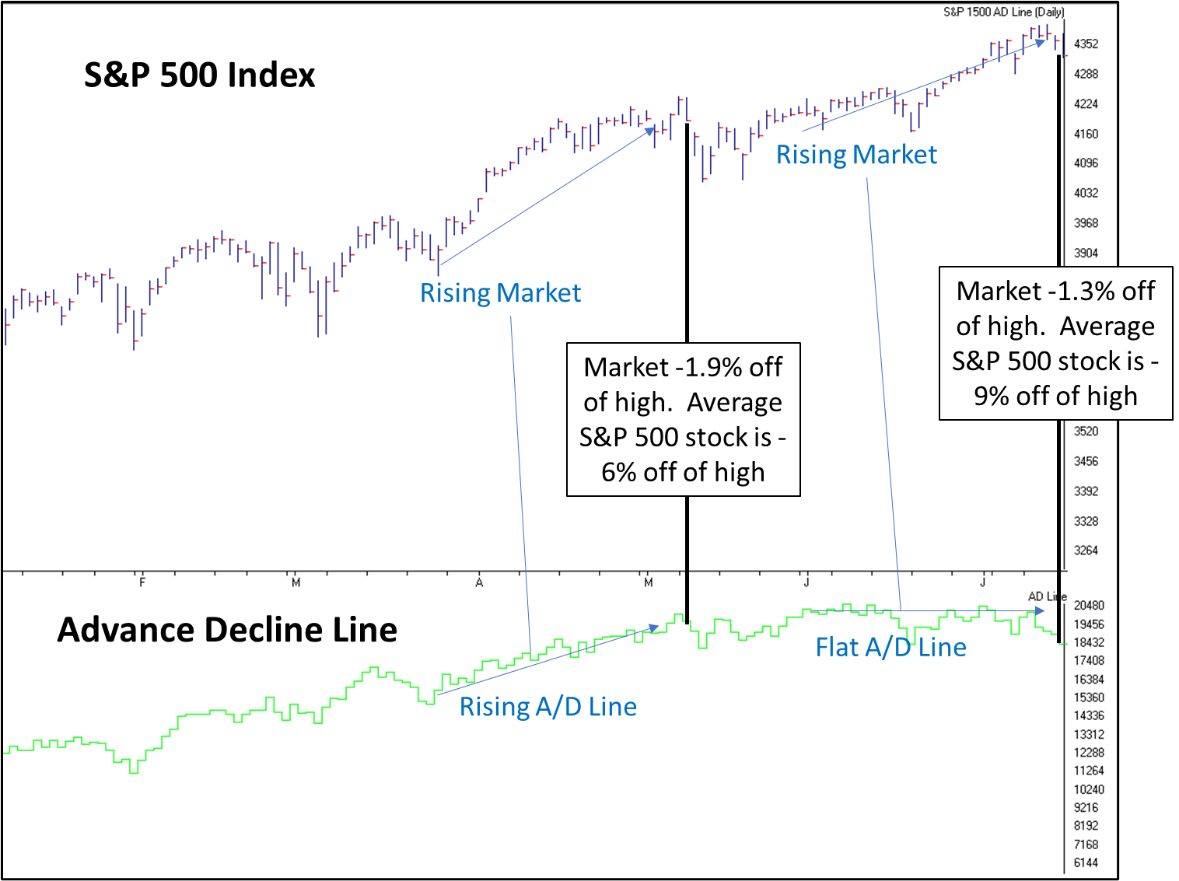
I want to build on these comments about market breadth and the markets recent movements using a few statistics.
Through Friday’s close, the S&P 500 was within 1.3% of an all-time high. When we break out the individual S&P 500 securities (of which there are 505), and look at how far each stock is off of its trailing 12 month high, we find that the average S&P 500 stock is about -9% off of its high for the last year.
How does this stack up to recent history? Well, we mentioned that market breadth has been flattening out, meaning not all stocks were rising with the market index. If we look at a similar time, which I arbitrarily chose to be mid-May, we can see that the S&P 500 was off of it’s high by -1.9%, and the A/D Line was also near its peak. The average stock within the index at this time was only off of its trailing 12 month high by -6%. In other words, the S&P 500 was off its high by more, but the average security was doing better relative to the market than it is today (About 3% on average better).
A look at Sector Leadership
In the table below, we ranked sector indexes on a volatility, or risk-adjusted basis. The top 4 sectors on a risk-adjusted basis are real estate, communications, technology, and Healthcare. Now, keeping in mind that the average stock is -9% off of its 12-month high, we would expect that top ranked sectors would have their average stock be better than average. Well, this is mostly true, with exception of one case:
| Sector Rank | Sector | Avg Stock % off of High |
| 1 | Real Estate (29 Stocks) | -3.21% |
| 2 | Communications (26 Stocks) | -15.96% |
| 3 | Info Tech (75 Stocks) | -8.87% |
| 4 | Health Care (62 Stocks) | -6.82% |
Source: Canterbury Investment Management
Now, why would Communications be the second highest ranked sector, but the average communications stock be off its 12-month high by -16%? Well, like the S&P 500, sector ETFs are also market capitalization weighted—larger stocks have more of an impact. In the case of communications, Facebook; Google; Disney; and T-Mobile account for 50% of the sector ETF’s movements. That’s 5 securities (Google has two different stocks) accounting for 60% of the movement in a sector that has 20 other securities in it. Those 5 securities are doing well.
What about the S&P 500? How could it be within 1.3% of its high while the average S&P stock is off by -9%? Well, it’s because of market cap and market breadth. The index has recently been led by the generals, while some of the troops faulter.
If we look at the S&P 500 stock weightings, the largest 15 stocks make up a third of the index’s movement! Of those 15 largest stocks, the average security is within 3% of a new high (as of Friday’s close). The other 490 securities are off by an average of -9.32%.
Bottom Line
There is a plethora of data and numbers listed about, but the bottom line here is that the market is being led by some of the largest components, while the smaller components are flat or struggling. This is a very short-term issue, so we will have to wait and see what it unfolds into. What we do not want to see is a falling A/D line with a rising market for an extended period.
With the recent market movements, as well as the outlier day experienced on Monday, the only major concern is whether or not we continue to see the market be held up by the larger, mostly tech-related securities. As for the outlier day, these types of days can occur when we see volatility get low and compressed. Typically, the markets shift back to a normal market environment. It’s like getting hit in the face with a cool glass of water. You wake up, are startled and don’t know where you’re at. It takes a few moments to gather your bearings. There is a possibility that we continue to see some rotations in market strength as the markets try to gain their footing after today.