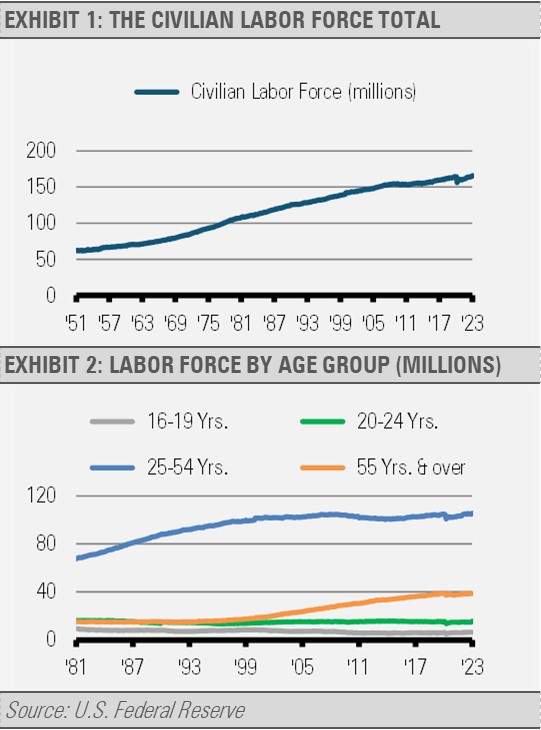
Even though the overall size of the U.S. labor force recently hit an all-time high, employers and customers alike feel the pinch of a lack of workers. At nearly 165 million people, the size of the civilian labor force 16 years old and above is now slightly larger than its previous peak in December of 2019.
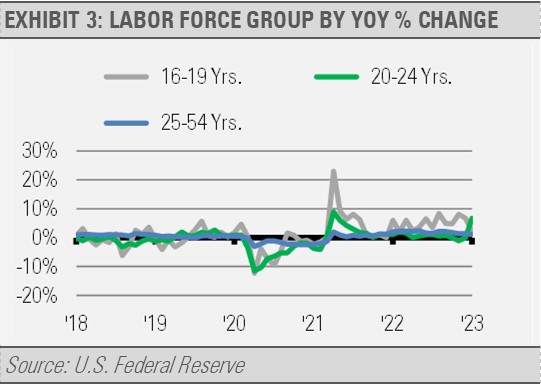
However, the growth rate of the civilian labor force has been declining since the early 1980s. This reduction was expected as the Baby Boomers began entering the labor force in the 1960s and influencing its growth rate and dynamics, such as the number of women entering the labor force, throughout the 1970s (exhibit 1). By breaking down labor force statistics into the major age cohorts, we can identify clear trends that are influencing everything from family dynamics to the wait times at your local restaurant (exhibit 2).
From an overall economic perspective, the size and participation rate of the 25-54 age cohort, also known as prime age workers, tends to be the most impactful. This is the group getting married, starting and raising families, and eventually getting to their highest earning years. At approximately 105 million people, this age group is just below its peak size reached in August of 2022. Still, the annual growth rate of this group has stagnated since the early 2000s. This stagnation probably has little impact on the lack of entry-level workers today but does have a broader impact on the long-term potential growth of the overall economy.
As you can see, the prime age workforce growth rate accelerated beginning in the early 1970s thanks to the Baby Boomer generation, or more accurately, their parents. That growth rate started to decline in the 1990s, due to the Baby Boomers not having as many children per person as their parents.
Consider that it takes 16 to 19 years to get into the earliest age cohort, 20 to 24 years to get into the next, and more than 24 years to get into the most economically productive age cohort. At the same time, older workers are moving out of that group each year. The stagnation in growth of the prime age worker cohort since the 2000s actually dates back to declining birth rates since the 1980s. The issues we are facing in finding entry-level workers under 25 years old began about that long ago.
Most relevant to the lack of entry-level workers are the youngest two age cohorts, those from 16 to 19 years old and those from 20 to 24 years old. Generally speaking, this group covers high school students and college age adults. While not a primary driver of economic growth in aggregate due to the lower incomes and spending associated with these groups, the size of this population and the labor force participation of this group may more directly impact the size and characteristics of the entry-level labor force.
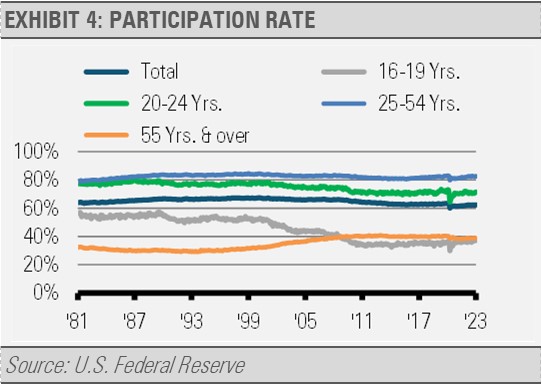
The annual growth rate of this group has been highly variable, but has been on the rise more recently, especially for the younger group. The increase in the growth rate of this youngest age cohort portends good news for the future growth rates of the older age cohorts as this younger group ages.
While the size of the labor force is key, the participation rate of the labor force and its underlying cohorts is also very impactful.
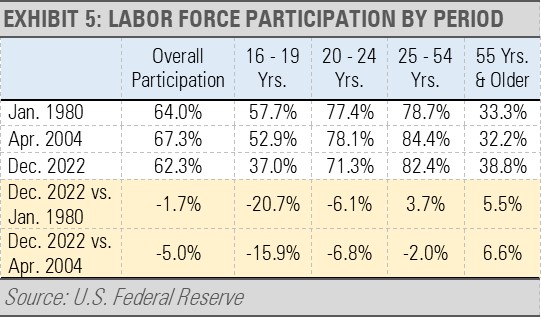
The overall labor force participation rate peaked in April of 2000 having declined 1.7% and 5.0% from January of 1980 and April of 2000, respectively.
Furthermore, when dissecting the labor force into its cohorts, we see that the percentage of young adults participating has declined since the late 1980s while the percentage of older Americans still working or looking for work has increased.
Not only are there more Americans in the 55 & over age cohort, the participation rate for those 55 years old and over has bucked the declining participation rate trend as older people are living longer, healthier lives. The biggest declines in the participation rate are for the youngest age cohorts, which are those often working entry-level jobs. This may have a lot to do with the lack of staffing we are seeing at service-oriented and retail jobs, but we note that this trend is not a new phenomenon.
We can see the impact of the declines in labor force participation rates in the youngest two age cohorts not only in longer wait times at local restaurants and retail stores, but also on our society more broadly. For example, according to the Pew Research Center, in July of 2022 half of the adults aged 18 to 29 were living with one or both of their parents. This was down from a recent peak of 52% in June of 2020 but still significantly higher than the share who were living with their parents in 2010 (44% on average that year) or 2000 (38%).
While the COVID-19 pandemic may have impacted these trends, the decline in the participation rate for young workers began more than three decades ago. This issue that has been brewing for decades has only become more apparent in the post-pandemic world. Just as we saw some positive signs from the increase in the growth rate of the size of the youngest age cohort, we also see positive signs from the participation rate data.
Young people will not live at home forever, especially as they mature further into adulthood, the economy grows, and the need for labor grows likewise.
By comparing the size of each of these younger age cohorts with the declining participation rates we have seen over recent decades, we can estimate the number of workers available to drive the U.S. economy going forward as rates normalize over time. For example, just getting back to the participation rates from the early 2000s would add approximately 4 million new young workers into the labor market.
Given some of the global economic trends we are seeing, such as onshoring and nearshoring, today’s inconveniences created by low labor force participation of the younger age cohorts are likely a near-term phenomenon. As these young people eventually move further into adulthood and enter their prime working years, the U.S. economy has a large store of untapped labor to propel strong economic growth for decades to come.
DISCLOSURES
Any forecasts, figures, opinions or investment techniques and strategies explained are Stringer Asset Management, LLC’s as of the date of publication. They are considered to be accurate at the time of writing, but no warranty of accuracy is given and no liability in respect to error or omission is accepted. They are subject to change without reference or notification. The views contained herein are not be taken as an advice or a recommendation to buy or sell any investment and the material should not be relied upon as containing sufficient information to support an investment decision. It should be noted that the value of investments and the income from them may fluctuate in accordance with market conditions and taxation agreements and investors may not get back the full amount invested.
Past performance and yield may not be a reliable guide to future performance. Current performance may be higher or lower than the performance quoted.
The securities identified and described may not represent all of the securities purchased, sold or recommended for client accounts. The reader should not assume that an investment in the securities identified was or will be profitable.
Data is provided by various sources and prepared by Stringer Asset Management, LLC and has not been verified or audited by an independent accountant.