
By Canterbury Investment Management
I hope everyone had a wonderful July 4th weekend.
Weekly Update Video: https://www.youtube.com/watch?v=2JqlwX2I1vI
Market State 1- Bullish: The S&P 500 remains in Market State 1 following a short week due to the 4th of July. The index broke out above its overhead resistance. At this point, it would not be uncommon for the index to pullback and test this support level.
According to David Vomund, who is a close friend of ours and an expert market technician:
“The glaring negative is the market is overbought. No, it’s extremely overbought! Currently, 100% of the stocks with unconfirmed AIQ* signals are on the sell side!”
*AIQ is referencing AIQ Trading Expert Pro, a technical analysis software
So, in other words, as we have said in the past few updates, the S&P 500 could be at/nearing a top and could soon experience a pullback.
Canterbury Volatility Index (CVI)- CVI 59- Volatility did not change much last week (starting at CVI 61 and ending the week at CVI 59). Low/decreasing volatility is a bullish characteristic. Canterbury also measures short-term volatility (10-day CVI). Currently short-term volatility is at CVI 44, which is right at “extreme low” volatility. When volatility becomes extremely low, it is common to see a single or few day outliers.
Comment
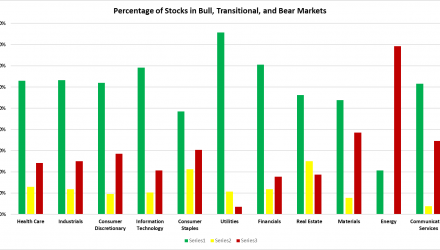
One topic we have discussed the past few weeks is the Advance/Decline Line, which measures market breadth. When the A/D Line and S&P 500 are both putting in higher highs at the same time, it is a positive indication that we are not at a major tipping point. This means that there are many stocks participating in the rally, rather than just a few heavier weighted stocks. We can confirm this by examining the individual stocks that make up the S&P 500 index. The chart below shows the layout of current S&P 500 stocks in bull markets, transitional markets, and bear markets per sector:
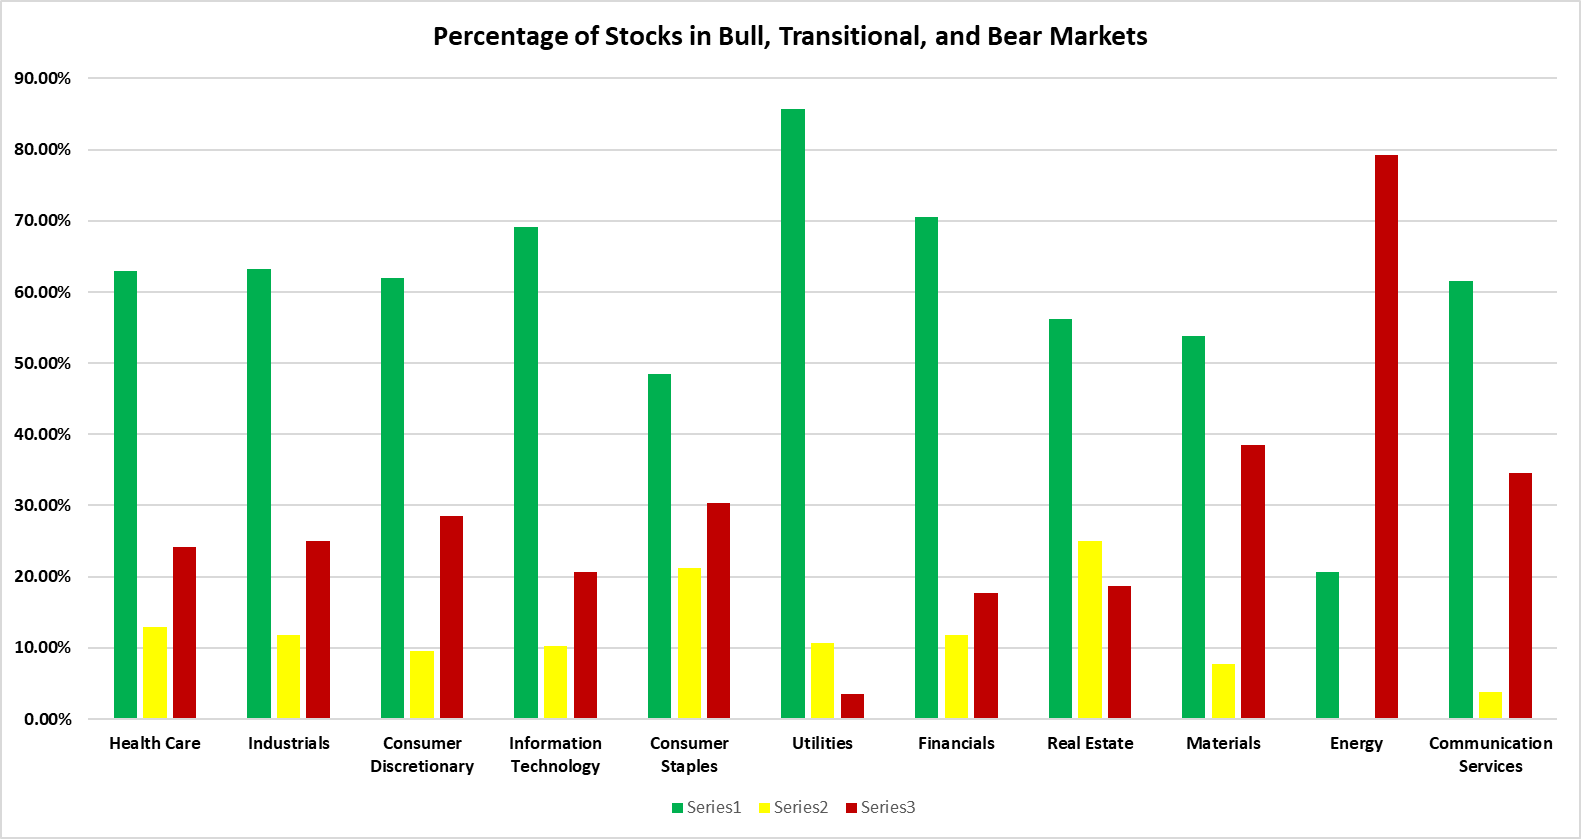
Source: Canterbury Portfolio Analytics
The above chart shows that with the exception of Energy, most sectors have a majority of their individual stocks showing bullish characteristics. In fact, 7 of the sectors shown have over 60% of their stocks in bullish market environments. The Utilities sector has 24/28 stocks (85%) in bull markets and technology, which is the largest S&P component has 47/68 stocks (69%) in bull security states. Overall, out of 503 S&P Stocks being measured, 310 are in bullish security states (62%), 58 are transitional (11%), and 135 are bearish (27%).
The S&P 500 is showing broad participation in the recent rally. It is not a case of just a few stocks carrying the rest. The largest 50 stocks in the S&P 500 make up about 50% of the S&P. So, 10% of the stocks make up 50% of the weight. However, since there is broad participation, an index composed of the 50 largest stocks has actually performed almost the exact same as an index composed of the next 453 stocks. Broad participation in bullish markets is a positive sign.
Bottom Line
The US Stock market is right at a peak level right now. The most likely move, from here, would be some sort of pullback. On a positive note, there is broad participation in the market, among the majority of the S&P sectors.
The S&P 500 is not a diversified portfolio; it is all equity. It will go through both bullish and bearish markets. Because of this, a fixed portfolio will also go through bullish and volatile bear markets. As investors, we cannot afford to take the major hit of a bear market, and thus give up years of compounded growth. By utilizing an Adaptive Portfolio Strategy, like the Canterbury Portfolio Thermostat, we have the ability to navigate any market environment- Bull or Bear.
This article was submitted by Canterbury Investment Management, a participant in the ETF Strategist Channel.