

By KEVIN NICHOLSON, CFA
THE RIVERFRONT WRITING TEAM:
- REBECCA FELTON Senior Market Strategist
- CHRIS KONSTANTINOS, CFA, Director of Investments | Chief Investment Strategist
- KEVIN NICHOLSON, CFA, Global Fixed Income Co-CIO | Co-Head of Investment Committee
- DOUG SANDLER, CFA, Head of Global Strategy
- ROD SMYTH, Chairman of the Board of Directors
SUMMARY
- OPEC’s supply constraints have allowed prices to more than double since November 2020.
- If shale drillers re-enter the market, we believe it’s unlikely they will overproduce.
- Thus, energy prices will remain elevated for the foreseeable future, in our opinion.
As society grows more comfortable incorporating Environmental, Social, and Governance (ESG) in portfolio decisions, the energy sector has been in the spotlight. Those responsible for making investment decisions no longer look solely at traditional energy sources that include petroleum, hydrocarbon gas liquid, natural gas, coal, and nuclear. Instead, renewables (solar, geothermal, wind, biomass, and hydropower) are considered as alternatives. However, despite the rise of ESG considerations in the energy space, oil is still at the top of the energy pyramid reflected by recent demand. The global pandemic slowed the demand for oil over the last 18 months but as the virus has waned, economies re-opened, and winter nears, demand is driving up the price of oil, in our opinion.
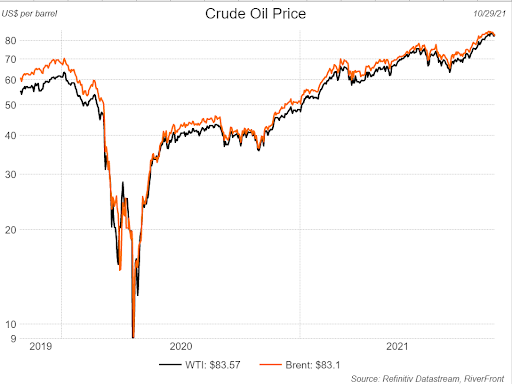
The oil benchmarks Brent crude and the US West Texas Intermediate (WTI) both have seen their prices more than double in the last year since bottoming November 2, 2020. We believe that higher prices will be maintained as long supply constraints remain in place.
What is Behind Rising Prices?
Higher oil prices are the result of both reduced production by top oil suppliers and a demand rebound close to pre-pandemic levels. For example, OPEC responded to the sharp decline in global demand in 2020, by cutting production by 10 million barrels a day (approximately 11% of production). In an effort to stabilize prices over the last year, OPEC and its allies have increased production incrementally, with the goal of eliminating the production deficit by April 2022.
Prior to the pandemic, global oil demand reached nearly 100 million barrels per day but fell to 83 million barrels per day in June 2020. Fast forward a year and demand was 95 million barrels per day as of the end of June 2021, according to the International
Energy Agency (IEA). As the global economy emerges from the pandemic, energy consumers are returning to work and traveling for leisure, creating additional demand for energy. Additionally, we are heading into winter months when historically stockpiles are drawn down thus helping to maintain current pricing until spring.
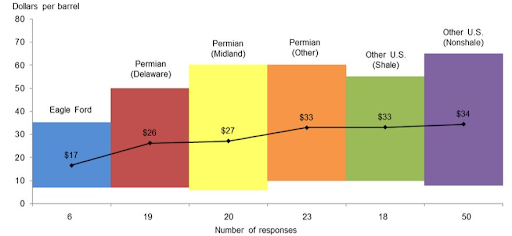
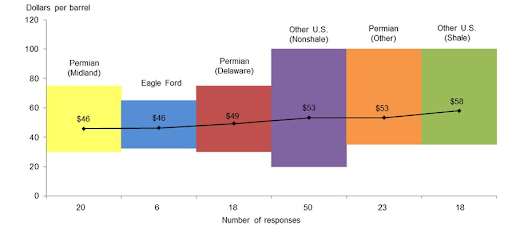
While OPEC and its allies were successful in propping up oil prices, shale drillers have forgone the opportunity to add supply to a constrained market largely due to reduced funding from private equity investors as they move to investments that are more climate change friendly. Thus far it does not appear that the shale industry is gearing up to join the party, as the number of drilled-but-uncompleted (DUC) wells has dropped from 8,934 wells in mid-2020 to 5,385 wells as of September. However, we believe that if prices continue to rise, currently above $80 for both Brent and WTI, shale drillers in the high-production areas of Texas and Oklahoma will be enticed to begin pumping oil again. The two charts below show that shale drillers in these areas have a breakeven of around $30 per barrel for existing wells and around $50 per barrel for new wells according to a 2021 survey done by the Dallas Federal Reserve, leaving plenty of room for profit at today’s elevated prices.
Opportunities for Increased Production
Breakeven Levels for Existing Wells
Breakeven Levels for New Wells
Profitability is even greater for shale drillers that can take advantage of today’s high natural gas prices since they can sell this natural by-product instead of flaring it (burning it off). Currently, natural gas prices are trading between $5 and $6 per Metric Million British Thermal Unit (MMBtu), which makes drilling more profitable if shale companies choose to sell the gas in addition to the oil.
Is Current Pricing Sustainable?
The question that investors are asking is whether current pricing levels are sustainable? The answer to this is complex but we will attempt to answer it in short order. First, we will look at OPEC’s production capacity which currently is estimated to be roughly 34.5 million barrels per day but as of September, the group was only producing slightly less than 27.5 million barrels per day. Given that there is spare capacity of approximately 7 million barrels per day, current pricing is sustainable if all members of OPEC stay in alignment, in our opinion. If any member decides not to comply and increases their production, current prices will come under pressure. In the US, there is a similar dynamic when we explore shale production. In 2019, the US shale producers were pumping just over 9.4 million barrels per day compared to slightly over 8.7 million barrels per day currently.
Conclusion:
The energy sector represents less than 3% of the S&P 500. However, it has a larger impact in our daily lives, from transportation and raw material costs for companies, to impacts on food, travel, and housing costs for consumers. Given the rise in oil prices, we believe shale drillers may re-enter the market. Additionally, in the near-term we believe the industry has learned from previous missteps and will not overproduce, keeping energy prices elevated for the foreseeable future. Currently, our portfolios are positioned broadly neutral to US energy, as we acknowledge that volatility could pick up in the sector if there are bad actors either amongst OPEC or the shale drillers.
For more news, information, and strategy, visit the ETF Strategist Channel.
Important Disclosure Information
The comments above refer generally to financial markets and not RiverFront portfolios or any related performance. Opinions expressed are current as of the date shown and are subject to change. Past performance is not indicative of future results and diversification does not ensure a profit or protect against loss. All investments carry some level of risk, including loss of principal. An investment cannot be made directly in an index.
Information or data shown or used in this material was received from sources believed to be reliable, but accuracy is not guaranteed.
This report does not provide recipients with information or advice that is sufficient on which to base an investment decision. This report does not take into account the specific investment objectives, financial situation or need of any particular client and may not be suitable for all types of investors. Recipients should consider the contents of this report as a single factor in making an investment decision. Additional fundamental and other analyses would be required to make an investment decision about any individual security identified in this report.
Chartered Financial Analyst is a professional designation given by the CFA Institute (formerly AIMR) that measures the competence and integrity of financial analysts. Candidates are required to pass three levels of exams covering areas such as accounting, economics, ethics, money management and security analysis. Four years of investment/financial career experience are required before one can become a CFA charterholder. Enrollees in the program must hold a bachelor’s degree.
Standard & Poor’s (S&P) 500 Index TR USD (Large Cap) measures the performance of 500 large cap stocks, which together represent about 80% of the total US equities market.
Brent blend is the name of one of two internationally-recognized types of crude oil that are used as benchmarks for prices of crude oil. Brent Blend comes from the North Sea and is considered a light, sweet crude oil. Brent blend is more than half of the crude oil traded internationally, so it is a logical choice to be the benchmark for crude oil pricing.
West Texas Intermediate (WTI) is a crude oil that serves as one of the main global oil benchmarks. It is sourced primarily from Texas and is one of the highest quality oils in the world, which is easy to refine.
The term Organization of the Petroleum Exporting Countries (OPEC) refers to a group of 13 of the world’s major oil-exporting nations. OPEC was founded in 1960 to coordinate the petroleum policies of its members and to provide member states with technical and economic aid.1 OPEC is a cartel that aims to manage the supply of oil in an effort to set the price of oil on the world market, in order to avoid fluctuations that might affect the economies of both producing and purchasing countries.
Investing in foreign companies poses additional risks since political and economic events unique to a country or region may affect those markets and their issuers. In addition to such general international risks, the portfolio may also be exposed to currency fluctuation risks and emerging markets risks as described further below.
Changes in the value of foreign currencies compared to the U.S. dollar may affect (positively or negatively) the value of the portfolio’s investments. Such currency movements may occur separately from, and/or in response to, events that do not otherwise affect the value of the security in the issuer’s home country. Also, the value of the portfolio may be influenced by currency exchange control regulations. The currencies of emerging market countries may experience significant declines against the U.S. dollar, and devaluation may occur subsequent to investments in these currencies by the portfolio.
Foreign investments, especially investments in emerging markets, can be riskier and more volatile than investments in the U.S. and are considered speculative and subject to heightened risks in addition to the general risks of investing in non-U.S. securities. Also, inflation and rapid fluctuations in inflation rates have had, and may continue to have, negative effects on the economies and securities markets of certain emerging market countries.
Stocks represent partial ownership of a corporation. If the corporation does well, its value increases, and investors share in the appreciation. However, if it goes bankrupt, or performs poorly, investors can lose their entire initial investment (i.e., the stock price can go to zero). Bonds represent a loan made by an investor to a corporation or government. As such, the investor gets a guaranteed interest rate for a specific period of time and expects to get their original investment back at the end of that time period, along with the interest earned. Investment risk is repayment of the principal (amount invested). In the event of a bankruptcy or other corporate disruption, bonds are senior to stocks. Investors should be aware of these differences prior to investing.
RiverFront Investment Group, LLC (“RiverFront”), is a registered investment adviser with the Securities and Exchange Commission. Registration as an investment adviser does not imply any level of skill or expertise. Any discussion of specific securities is provided for informational purposes only and should not be deemed as investment advice or a recommendation to buy or sell any individual security mentioned. RiverFront is affiliated with Robert W. Baird & Co. Incorporated (“Baird”), member FINRA/SIPC, from its minority ownership interest in RiverFront. RiverFront is owned primarily by its employees through RiverFront Investment Holding Group, LLC, the holding company for RiverFront. Baird Financial Corporation (BFC) is a minority owner of RiverFront Investment Holding Group, LLC and therefore an indirect owner of RiverFront. BFC is the parent company of Robert W. Baird & Co. Incorporated, a registered broker/dealer and investment adviser.
To review other risks and more information about RiverFront, please visit the website at www.riverfrontig.com and the Form ADV, Part 2A. Copyright ©2021 RiverFront Investment Group. All Rights Reserved. ID 1901521