

By Dave Haviland, Beaumont Capital
At the end of 2018, interest rates were heading higher due to a hawkish Federal Reserve (FED); both global trade and manufacturing were slowing as the trade war raged on; and earnings expectations were being revised down. This led investors to conclude that the economy was slowing both abroad and here at home. Due to all of this, global equities, represented by the MSCI ACWI Index, suffered their eighth worst¹ quarterly loss in 30 years.
What a difference three months can make! Today, the bear has run back into its cave, the Fed has turned dovish, interest rates have plummeted, and stock markets have mostly recovered. The first quarter of 2019 was the best quarter for global equities since 1998 and the 11th best of all time!²
It was a similar story for the S&P 500; after falling ~13.8% in 4Q18, the index rebounded 13.1% and at quarter end sits about 3.3% from its all-time highs. While the drawdown and rebound pattern occurs fairly often, what is unique was the magnitude and speed of this cycle. Since World War II, no other correction/bear has fallen as far and rebounded as fast as what we have just witnessed.
Dovish Fed: Is the market overreacting to the upside?
In 2018, as the decidedly hawkish FED continued to raise interest rates, they were projecting several more increases in 2019. In addition, their policy on reversing the trillions of Quantitative Easing (QE) remained in place. As interest rates rose across the yield curve, the economy clearly had trouble digesting these changes and it was most readily apparent in the housing market. Interest rates rose to the point where they broke a 35-year downtrend. Mortgage rates were rising which choked new and existing home sales. Trouble in the housing market, and other cyclical sectors in the economy, caused investors to begin to worry about a slowdown in the economy as a whole, and stock prices reacted accordingly.
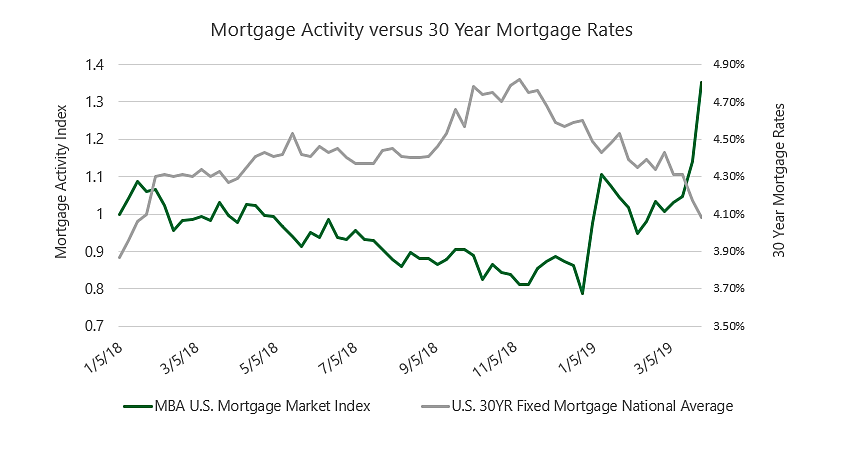
In the first quarter of 2019 the FED stopped raising rates and told the world that future rate increases were on hold. In addition, they outlined a plan to stop QE-reversal and stated that their balance sheet would remain at levels more than four times higher than those prior to the Great Recession (accommodative monetary policy remains). As we wrote to Chairman Powell, this was a welcome reversal and it set the stage for the markets to recover. Our concern is that just as the market likely overreacted to the downside in 2018, it may also have overreacted on the upside so far in 2019. Stock markets often overreact as the human emotions of fear and greed work their magic.
Declining PMIs: Is it too late to avoid a manufacturing recession?
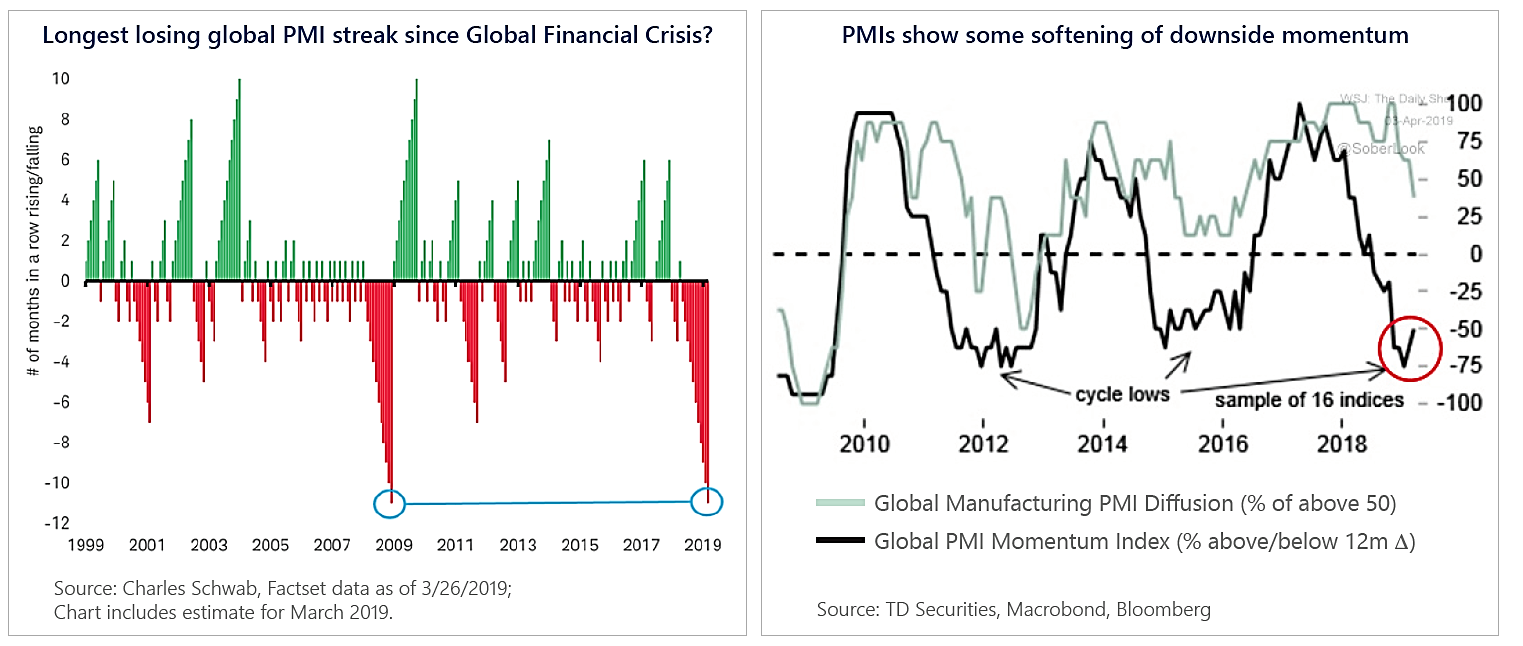
Global manufacturing, trade and earnings trends have been declining since the U.S. introduced tariffs in 2018. Even if we’re able to strike a trade deal with China, is it too late to avoid a manufacturing recession? For anyone who reads our chart blog, you will be familiar with the decreases in global manufacturing as measured by the Purchasing Managers Indices (PMIs). PMIs come in many “flavors” (manufacturing, service, composite, etc.). We have focused on the manufacturing PMIs due to their downward trend and the effects this might have on global earnings. While the U.S. has kept its head above water at around 52 (50 is the dividing line between growth and contraction), China, Japan, Europe, Mexico, Canada and most other significant economies have seen their manufacturing PMIs fall to 50 or even lower indicating that manufacturing is contracting. The chart below (left) shows that this global manufacturing slowdown has matched the duration of the Great Recession’s slowdown in 2008-09. However, recent March reports show that perhaps the negative trend has slowed or even bottomed.
U.S. Housing: Why is this once robust growth engine struggling?
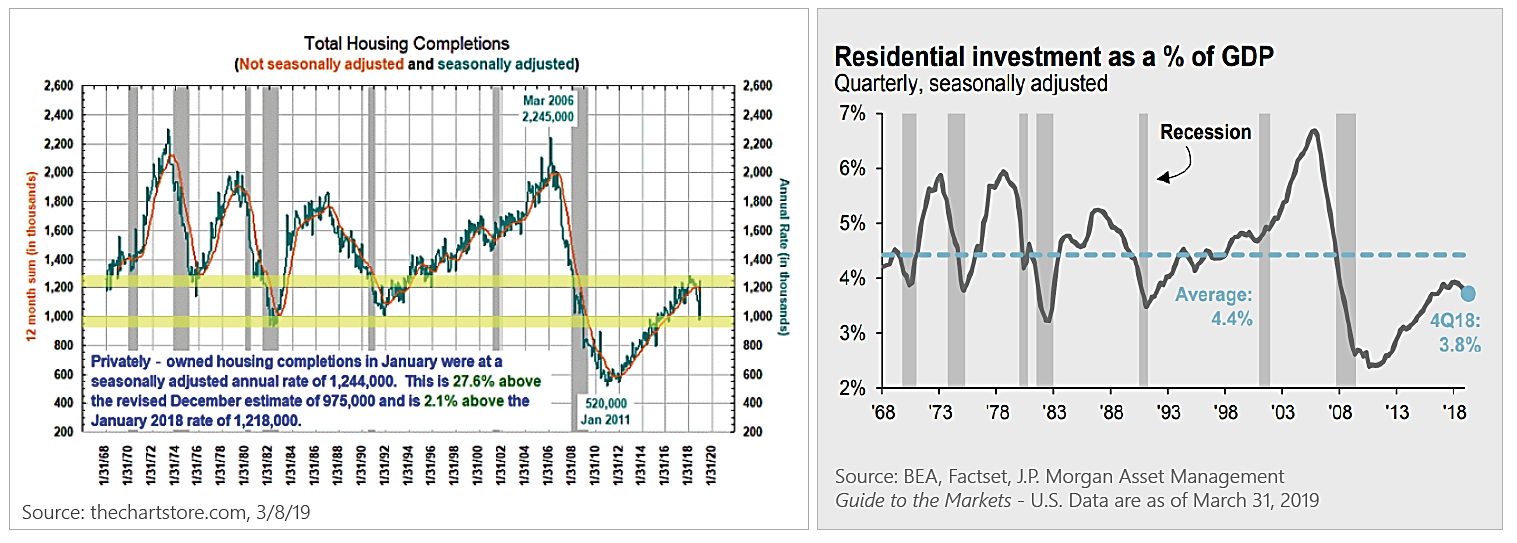
In past cycles, U.S. housing has been a driver of growth. New housing spurs on raw material purchases such as lumber, copper and cement, employs the trades (carpenters, plumbers, etc.), creates demand for durable goods (washer/dryers, furnaces, etc.), creates demand for discretionary items like curtains and furniture, and even drives post-building economic activity such as landscapers, telephony and utilities. Yet as the charts on the following page illustrate, the Great Recession decimated housing to new lows. While housing has recovered, it has only recovered to the levels of the troughs of the previous four cycles. One of the reasons the economy has been growing in the low single digit range is that the residential spending that typically follows a recession never got close to the long-term average of 4.4%, let alone to the 6-7% peaks of previous cycles. This is all in spite of some of the lowest interest rates in the modern economic era.
Inverted Yield Curve: Is this pointing to a recession?
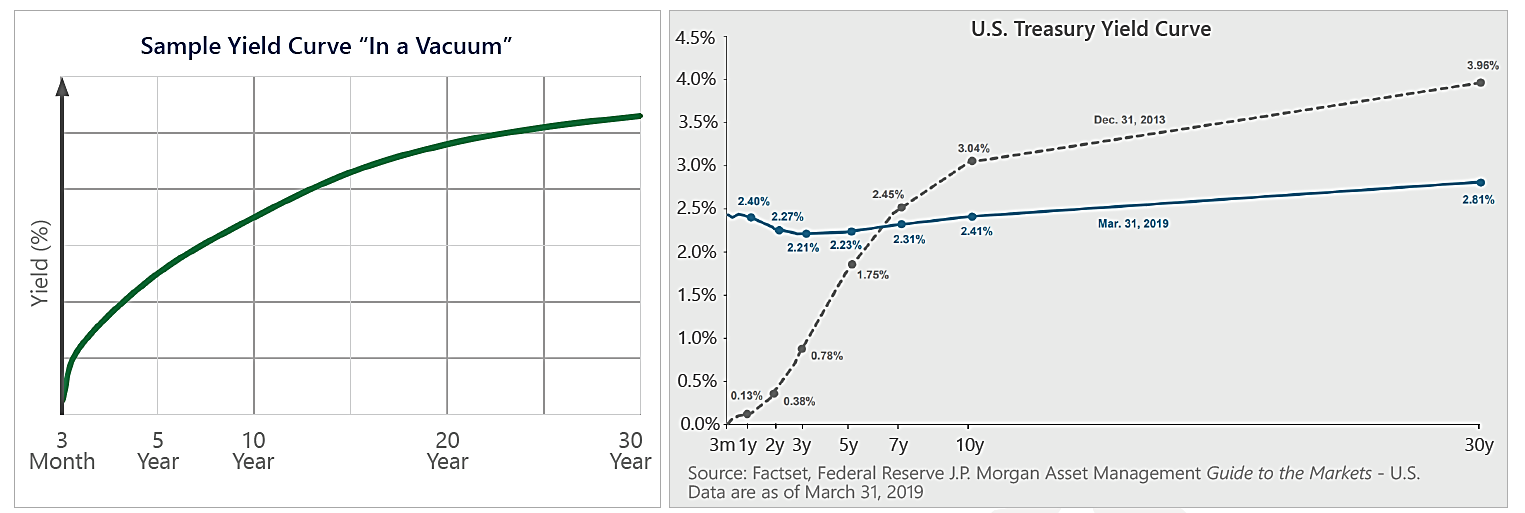
In a vacuum, a yield curve should look something like the bottom left chart. Shorter term interest rates are lower as the major risks for bonds (inflation, default, etc.) rise with the uncertainties of time and thus investors wish to be paid more for lending money for longer periods of time. A yield curve inversion occurs when shorter term interest rates are higher than longer term interest rates. This occurs when investors fear that economic conditions will be worse in the future than they are now. Since WWII, a 2-10 year yield curve inversion has been a reliable predictor of a pending recession, on average a recession occurs 14 months after an inversion³. When did the U.S. yield curve start to invert? December 3, 2018. This certainly helped accelerate the 4Q18 market sell off. Yet today, the inversion is longer and deeper in the U.S. and many large economies also have inverted yield curves. Germany and Japan have started to invert with negative yields! Are all these negative yield curves predicting a global recession? We are in the second longest economic expansion in history…it has to end sometime!
Conclusion: Where are we now?
At the end of 2018, the markets traded as if a recession was on the horizon. Now, a mere three months later, price action suggests that only clear skies are ahead. We believe the truth is somewhere in the middle. Over the past six months to a year, we’ve learned that the U.S. and global economies are not as strong as we thought they were. The markets are clearly expecting an economic turnaround; if it materializes, we believe the markets will be on solid ground going forward, but if not, then trouble may be ahead. As always, we’ll continue to trust our quantitative systems to lead us through these ever challenging market environments.
This article was contributed by Dave Haviland, Portfolio Manager at Beaumont Capital Management, a participant in the ETF Strategist Channel.
For more insights like these, visit BCM’s blog at blog.investbcm.com.
Sources and Disclosures:
¹Mathew Bartolini, CFA, “March ETF Flows: The Market’s Fast Break Offense, is it Sustainable?”, SPDR® Blog, April 4, 2019
²Id.