

By Beaumont Capital team
Which index has realized the highest 1-year return through June 30th, 2019?
a) S&P 500® Index
b) MSCI Emerging Markets Index
c) Russell 2000 Index (Small Cap)
d) Bloomberg Barclays U.S. Long Treasury Index
Don’t overthink it! The answer is D, the Bloomberg Barclays U.S. Long Treasury Index (Long Treasuries). This is a question that we’ve posed to many clients over the past quarter to illustrate just how odd this market environment has been. Despite making a new all-time high just last week, the S&P 500 has underperformed Long Treasuries over the past year. What’s even more interesting is that the majority of the positive performance for Long Treasuries occurred in 2019, not during the equity market drawdown in the fourth quarter of 2018.
Since the beginning of the year, the yields on U.S. 10-Year and 30-Year Treasuries have fallen by 68 and 49 basis points, respectively. Falling yields are generally associated with slowing economic activity or a risk-off appetite among investors. One would expect such an environment to be negative for equity investors but, so far, that has not been the case. In fact, when the 30-Year U.S. Treasury has outperformed the S&P 500 on a one-year basis, the average return of the S&P during these years is only 0.21%. As the chart below shows, the data supports the intuition that typically better relative long-bond performance is associated with worse (and all of THE worst) S&P 500 returns.
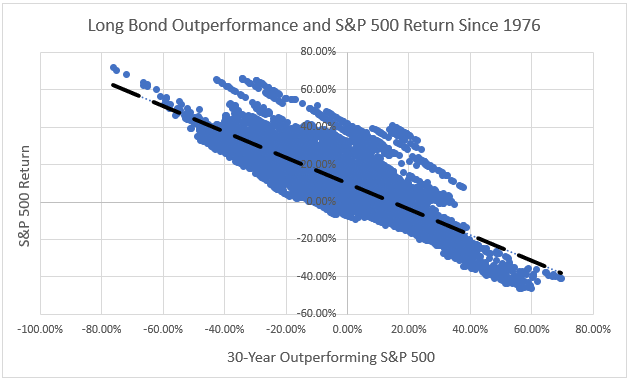
Source: Bloomberg, Beaumont Capital Management. Data is for the period 12/31/76 through 6/30/19
Furthermore, the second quarter’s fixed income performance is in the top quartile for both U.S. and Global bonds since 1976, and since 2009, this has been the best 6 months for the Barclays Bloomberg Aggregate Bond Index (BBAB). This has all occurred despite some of the lowest starting yields on record. Remarkably, even as equity markets have recovered, fixed income has continued its outperformance on a risk-adjusted basis.

Source: Bloomberg, Beaumont Capital Management. Data is for the period 6/30/14 through 6/30/19
This information reinforces the uniqueness of the fourth quarter of 2018’s near bear market (-19.7%), which now looks to be among the most speculative in recent memory. The S&P 500’s movements over the past year have been driven almost entirely by rapid changes in its earnings multiple; a fancy way of saying that the prices keep changing while the earnings are not. While future earnings expectations had come down markedly towards the end of 2018, unlike the past large drawdowns in 2011 and 2016, actual reported S&P 500 earnings have not yet had a decline. As a result, investors seem to have quickly amended their prior bearish predictions, creating this snap back rally which has driven the multiple re-expansion we have seen in 2019. It appears the twin catalysts for the ongoing equity market rally have been the speculation that we may reach an agreement on the China trade war and a decidedly more dovish policy from the U.S. Federal Reserve Bank (Fed).

Source: Demetri Nikolias, BCA; WSJ Daily Shot, 6/25/19
Ultimately, the market is judged by the earnings that stocks produce. Looking ahead, investors must determine if the declining growth rates we have seen in the first half of 2019 are evidence of a weakening overall economy or simply a result of challenging comparisons to 2017 and 2018. The corporate tax cut may have driven growth artificially higher in 2018 by incentivizing companies to increase their capital spending prior to 2018, knowing their profits would be taxed at a lower rate in the future. If this is true, investors may come to realize the underlying economic trends are stronger than they appear, and earnings growth may indeed re-accelerate— perhaps justifying the market’s year-to-date multiple expansion.
Trade War Update
Truce! No more tariffs! Hooray! Oh, wait, just no more new tariffs… for now, unless talks break down again… Tariffs are nothing more than a tax on imported goods and services that create uncertainty for corporations and consumers alike. These increased costs must be absorbed by companies and/or consumers either as reduced profits or higher prices, or a bit of both. Tariffs decrease free trade. Reduced trade leads to lower revenues. Lower revenues may eventually affect profits. There is a reason the S&P 500’s 2019 and 2020 earnings estimates are being revised lower. For those of you who read our blog (blog.investbcm.com), the cause and effect of tariffs have been made clear over the past year. The trade war has already led four of the world’s top five economies into a manufacturing recession with the fifth—the U.S.—hanging on the precipice.
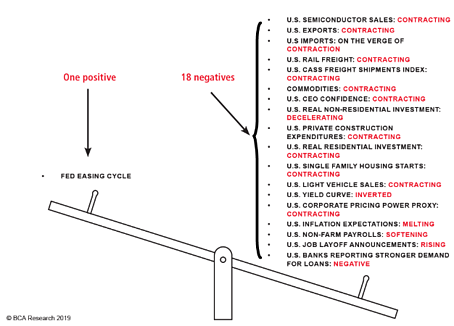
The Federal Reserve
The FED is doing an incredible job managing its three mandates and stewarding this expansion. Yet according to bond market futures, more than three rate cuts have been priced into the U.S. bond markets. Are the bond markets being too optimistic? What about the equity markets?
We still agree with the adage of “don’t fight the Fed.” However, Fed easing cycles have rarely occurred in an economic expansion. If multiple rate cuts are indeed needed in the current economic environment, we believe equity investors should be careful treating that as a cause for celebration.
Source: Demetri Nikolias, BCA; WSJ Daily Shot, 6/25/19
What does this all mean?
While the stock markets love to climb a “wall of worry,” it’s easy to see why investors may be on edge. We’ve enjoyed many favorable trends in the U.S over the past decade: As of July 1st, we’re now in the longest economic expansion in U.S. history, ten years and counting. U.S. equities outperformed their international brethren substantially over this period. U.S. interest rates have remained low and after this year’s decline we wonder if they will revisit the 2012 and 2016 lows. Can these trends continue? Of course! But we believe it’s imprudent to bet that they will last forever. With change comes opportunity.
As a predominantly quantitative investment manager, our rules-based systems use probability to try to determine the best times and asset classes to invest in. We view our models’ actions as akin to a skilled blackjack player counting cards. We don’t know the future, but our systems are designed to risk investor capital when the odds are in our favor. Periods like 2019 may be frustrating in hindsight, just as losing a hand when the deck is “hot,” but that doesn’t mean that our actions weren’t the best decision at the time. At BCM, we feel the most important investment rule is “don’t lose a lot of money.” Adhering to this maxim may make investors uncomfortable at times as our systems assess and seek to avoid elevated and perhaps undesirable risk. No manager can always be “right,” but if we’re right more than we’re wrong over time, investors should realize an acceptable result.
On a separate note, we welcome our new National Sales Director, Tod Perry. Tod joins us from F.U.S.E. Research Network and has enjoyed an extensive career in sales and sales management at firms such as Charles Schwab and State Street Global Advisors. We are more than excited to have Tod’s experience and expertise, and you may meet him soon as he begins his introductory tour of our great country.
This article was contributed by Dave Haviland, Portfolio Manager at Beaumont Capital Management, a participant in the ETF Strategist Channel.
For more insights like these, visit BCM’s blog at blog.investbcm.com.