

Confluence Investment Management offers various asset allocation products which are managed using “top down,” or macro, analysis. We publish asset allocation thoughts on a weekly basis in this report, updating the report every Friday, along with an accompanying podcast.
In the 1980s, economic graduate students were taught that the “wealth effect” was minor at best. It is a behavioral theory that measures the impact of rising wealth on consumption. In theory, when a household’s assets increase in excess of its liabilities, there should be a tendency for its spending to rise. However, for much of the postwar period, the impact of asset prices was negligible. Consumption was much more sensitive to income. However, around 1995, the relationship between net worth and consumption rose significantly1.
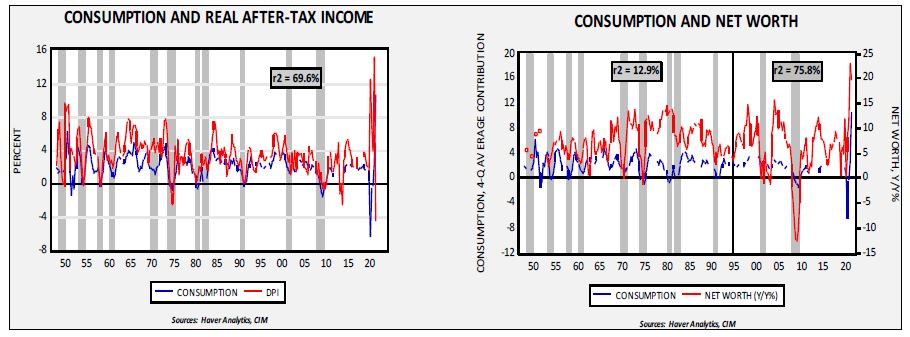
The relationship between inflation-adjusted after-tax income and consumption is high, with a 69.6% positive correlation. The chart on the right shows that from 1947 to 1995, the yearly change in net worth and consumption was essentially uncorrelated; after 1995 into late 2019, the correlation jumped to 75.8%.
Why was net worth mostly irrelevant to consumption and then suddenly becoming so important? We suspect the change in regulation that made it easier for homeowners to tap home equity played a role. We also suspect that lower tax rates on capital gains likely encouraged financial asset holders to sell assets to fund consumption.
When net worth was independent of consumption, policymakers could mostly ignore the impact of financial market declines2. Although the Fed has a mandate to act as lender of last resort, if most of the problems caused by financial stress were contained in the financial system, the FOMC could wait until it was clear that stress was becoming a risk to the financial system itself. But, if a decline in net worth triggers a drop in consumption, the Fed’s full employment mandate requires it to lower rates to boost the economy. At the same time, making market rescue an overt policy objective invites moral hazard.
So, does the Fed change policy due to market conditions? We think a case can be made that it does.
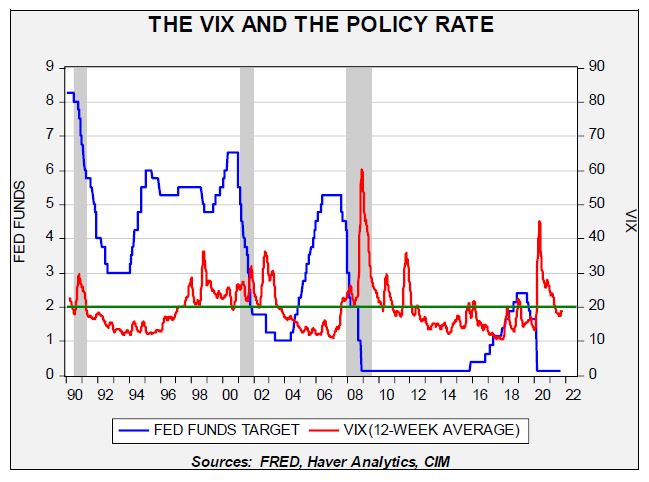
Above is a weekly chart of the fed funds target rate and the weekly VIX, smoothed with a 12-week moving average. We have placed a line at the 20 level for the VIX. In the late 1990s, the FOMC raised the target rate despite the VIX persistently trading over 20. At the onset of the 2001 recession, the FOMC dramatically cut the fed funds target and kept cutting until the smoothed VIX fell below 20. It only began raising rates with the VIX comfortably under 20. Its easing cycle started before the recession began in December 2007, just after the smoothed VIX rose above 20. The FOMC waited to raise rates after the smoothed VIX fell below 20, although it did begin to taper its QE in 2013. When the first rate hike began in December 2015, the smooth VIX jumped over 20, and the FOMC waited for several months until it fell below 20 before resuming the tightening cycle. That tightening cycle ended once the smoothed VIX moved over 20. The easing cycle did begin in Q3 2019, with the VIX under 20, mostly due to a problem in the money markets. Of course, easing accelerated as the smoothed VIX soared due to the pandemic.
When will the FOMC move to raise rates? If the history of the past two decades offers any insight, we would look for a smoothed VIX under 20 for a few months before policymakers move to raise rates. Why? Because falling household asset prices increase the risk of a pullback in consumption and a rise in recession probabilities.
The relationship of the smoothed VIX to the fed funds target suggests the FOMC does take equity market activity into account when setting the policy rate. Although this behavior doesn’t exactly mean the Fed targets the stock market, it does pay attention to financial market stability. So, the path of policy tightening will be, at least in part, tied to equity market volatility.
1 On the consumption charts, the left chart shows yearly change. The right chart shows yearly change with net worth advanced by one quarter after 1995. Correlations in both charts exclude the pandemic, which distorts the relationship in both cases.
2 Real estate assets matter too, but since housing prices rarely fall (of course, the exception was after 2005) financial market declines are more relevant.
Past performance is no guarantee of future results. Information provided in this report is for educational and illustrative purposes only and should not be construed as individualized investment advice or a recommendation. The investment or strategy discussed may not be suitable for all investors. Investors must make their own decisions based on their specific investment objectives and financial circumstances. Opinions expressed are current as of the date shown and are subject to change.
This report was prepared by Confluence Investment Management LLC and reflects the current opinion of the authors. It is based upon sources and data believed to be accurate and reliable. Opinions and forward-looking statements expressed are subject to change. This is not a solicitation or an offer to buy or sell any security.