

This level is much higher than the historical average of 3.7. At the peak before the prior housing crisis, the average home cost roughly 5 times the median annual income (see Figure 2), we are getting closer to that bubble level.
Figure 2: Housing Affordability Index (= Case/Shiller National Home Price Index/Medium Annual Income)
![]()
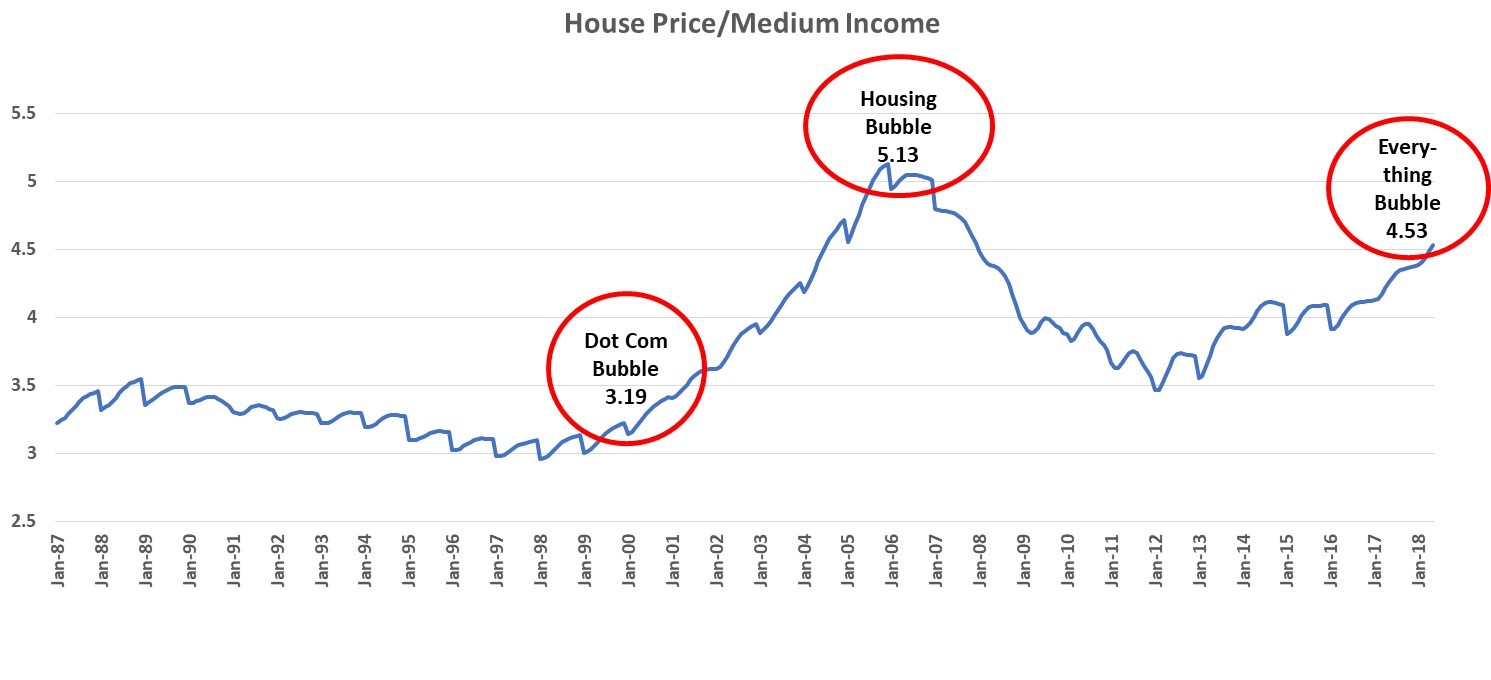
Data Source: Federal Reserve Bank of St. Louis.
Corporate credits are also close to a bubble level. The Bank of America Merrill Lynch High Yield bond credit spread, which measures the premium over Treasuries a low-quality company has to pay in order to raise capital, has declined to 3.4%. The average spread is much higher at 5.7%. Another troubling sign in the credit market is the re-surge of the CDOs (collateralized debt obligations), the very complex securities that almost brought down the financial system during the Great Recession. The total issuance of CDOs in 2017 reached $150 billion, according to Asset-Backed Alert. Although the issuance amount is lower than that during the housing bubble, it indicates the speculative and reckless behaviors are coming back into the system.
Figure 3: Historical Bank of America Merrill Lynch US High Yield Bond Option-Adjusted Spread
![]()
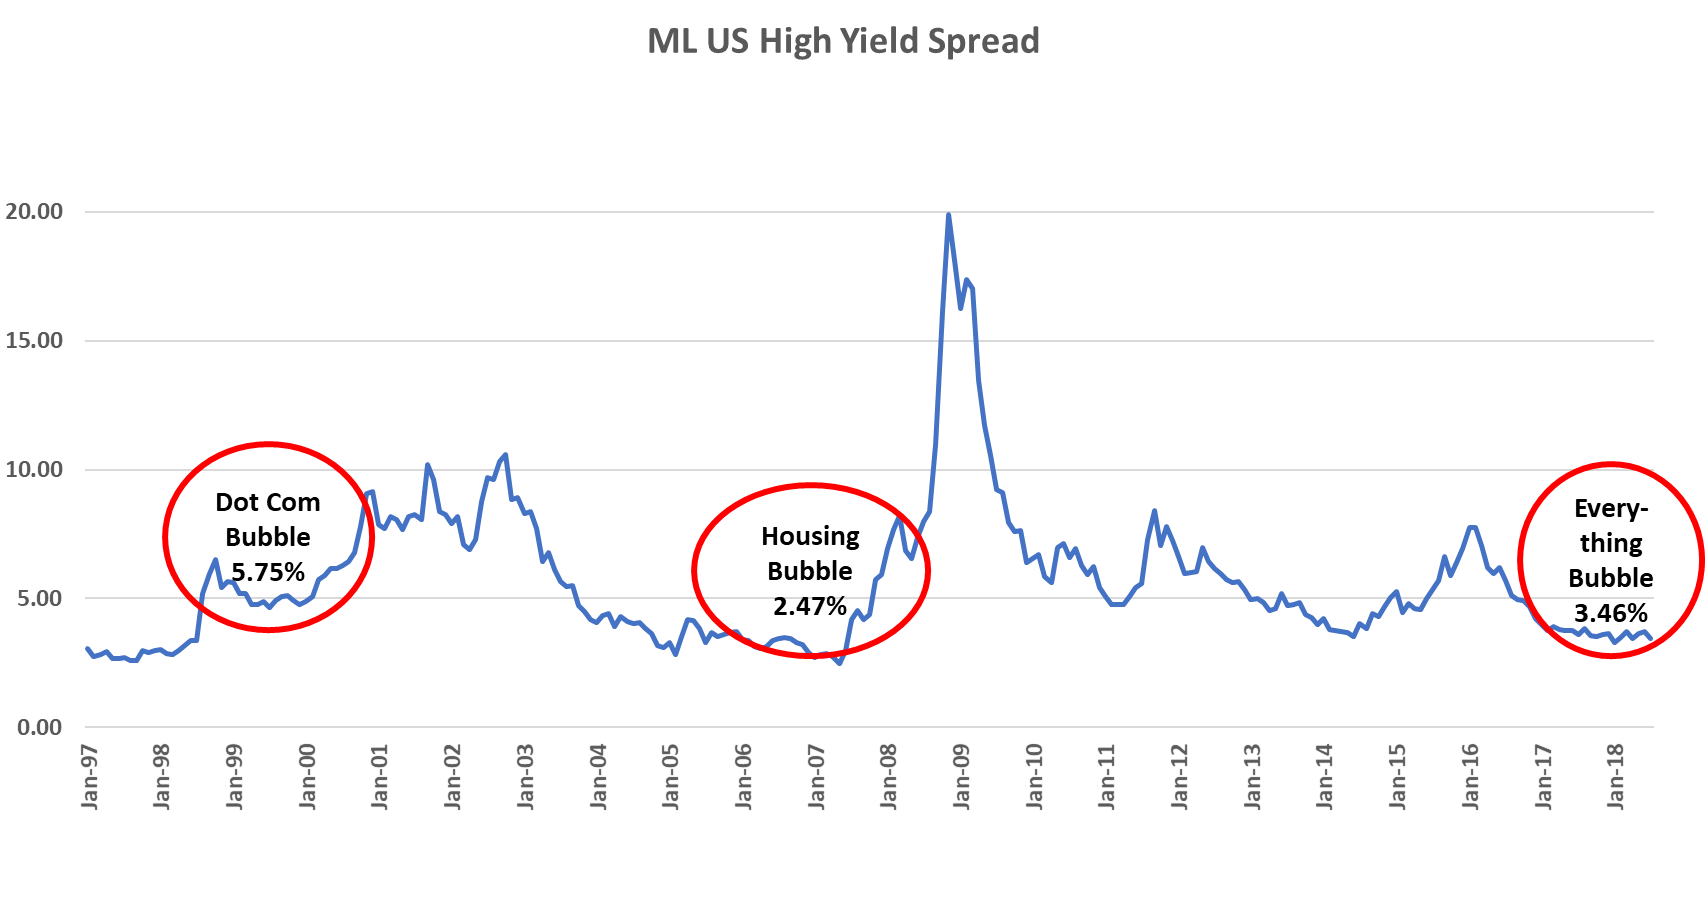
Data Source: Federal Reserve Bank of St. Louis.
Stocks, housing and credits have all become very expensive and we are definitely entering into an “everything bubble” if we are not in it now. We all know that every bubble will burst eventually. The root cause of the bubbles are mostly loose monetary policies. When cheap money is pumped into the financial system, asset prices are inflated as a result. Historically, the catalyst for bubble burst was rising interest rates (see Figure 4). In the current cycle, the Fed started raising interest rates in December 2015 from zero percent at a measured pace. So far, the Fed is in no hurry to deflate the asset prices because inflation rate remains benign. Therefore, we expect this “everything bubble” may inflate more before the next downturn, which could be very severe.
Figure 4: Historical Effective Federal Funds Rate

Data Source: Federal Reserve Bank of St. Louis.
Henry Ma is the President & CIO at Julex Capital Management, a participant in the ETF Strategist Channel.
Disclosure: This article is for the purpose of information exchange only. It is not a solicitation or offer to buy or sell any security. You must do your own due diligence and consult a professional investment advisor before making any investment decisions. All information posted is believed to come from reliable sources. We do not warrant the accuracy or completeness of information made available and therefore will not be liable for any losses incurred.