We have become famous (or infamous) regarding our views that there is a bubble in long-duration assets. In a previous report we highlighted the five common characteristics of financial bubbles and how each is currently present within the financial markets [“Bubble? 5 for 5”]. By our reckoning, there should be no doubt there are sizable bubbles inflating.
In this report, we investigate what’s causing such widespread bubbles, their potential effects on the overall economy, and the interesting investment opportunities resulting from the bubble’s misallocation of capital. The diagram below summarizes the bubble’s gestation and the potential investment implications.
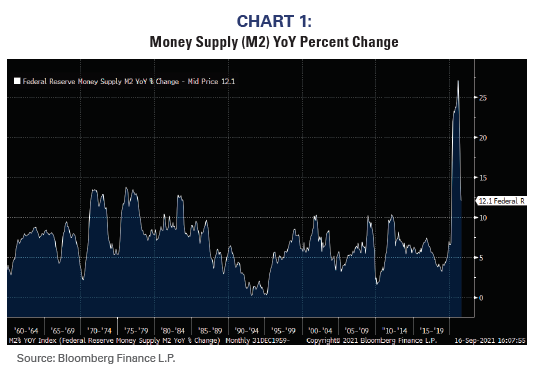
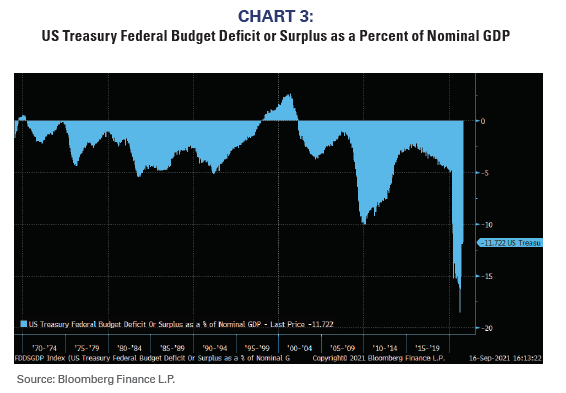
Immense monetary and fiscal stimulus.
It’s well known the Federal Reserve and the government responded to the pandemic with historic levels of stimulus. Some economists have suggested such aggressive policies should remain because of the uncertainty surrounding the future path of the pandemic or of the economy, but there is rarely any certainty about the future economy.
Charts 1, 2, and 3 show the magnitude of the monetary and fiscal stimulus relative to history both in terms of size and longevity. It seems reasonable to suggest the bubble has been inflated by the economy not being able to absorb all the monetary stimulus.
Fed “corners” the 10–20-year Treasury market
Because short-term interest rates fell to 0% subsequent to the global financial crisis, the Fed chose to inject additional liquidity by purchasing longer-term maturity debt. Typically, the Fed controls the short end of the yield curve by buying and selling short-term
T-bills. Their newer strategy of “quantitative easing” was based on the buying of longer-dated Treasury and mortgage bonds.
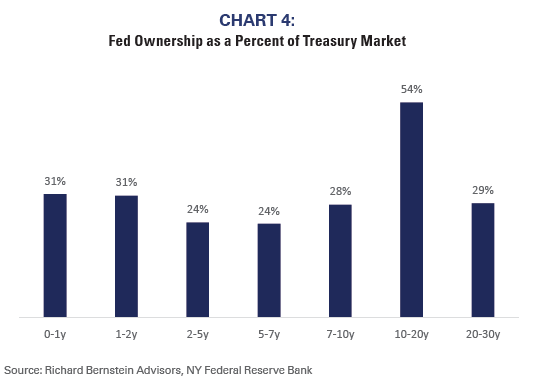
Because their buying has been sizable and lengthy, the Fed now owns a majority of the 10-20 year Treasury market. They have effectively “cornered” the treasury market. The Corporate Finance Institute defines cornering a market as “obtaining and holding/ owning enough stocks, assets, or commodities to effectively control the market price of said items. It involves acquiring the biggest market share without becoming a monopoly.”
The Hunt brothers infamously attempted to corner the silver market in the early-1980s by owning about 30-35% of the silver market. The Fed today owns over 50% of the 10-20 year Treasury market! (See Chart 4)
Cornering a market forces artificially high prices or, in the Fed’s case today, artificially low yields. The artificially low longer-term Treasury yields have been a primary catalyst to the bubble in long- duration assets.
Artificial flattening of the yield curve
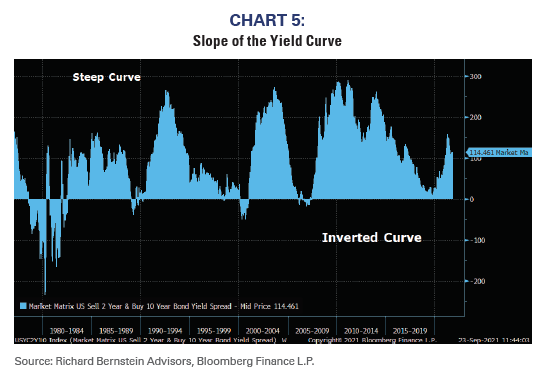
The slope of the yield curve has historically been a reasonable predictor of future nominal growth (i.e., real growth plus inflation) with steeper curves forecasting stronger growth and inverted curves suggesting recession.
One would think if historic monetary and fiscal stimuli were going to be effective, then the yield curve should be very steep. However, the Fed has artificially flattened the curve by cornering the long-term Treasury market. Chart 5 shows the spread between the 10-year T-note and the 2-year T-bill, and the curve seems remarkably flat relative to historic stimulus. For example, curves after the 2000 and 2008 recessions were much steeper despite there being large, but smaller, stimulus programs.
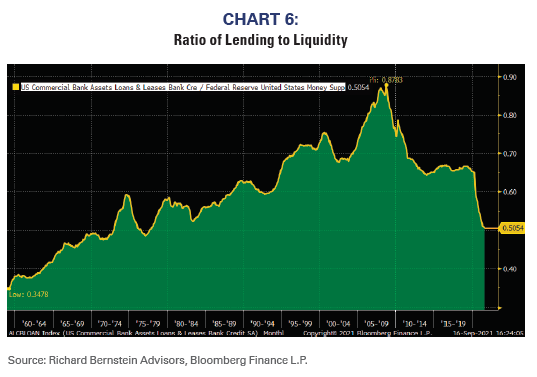
Bank lending lags liquidity
The yield curve is also a simple model of the profitability of bank loans, and a flatter curve suggests less attractive lending margins. Banks take in deposits and pay short-term interest rates to depositors, and they make loans with longer terms. Bank margins, therefore, can be approximated by the steepness of the yield curve, i.e., steeper curves suggest higher profitability.
Banks historically often continued to lend during prior cycles despite a flatter yield curve because they would use leverage to improve the profitability of low margin lending. Regulations put in place after the global financial crisis prohibit significant use of leverage, so the margin depicted by the yield curve has become more meaningful.
Because the Fed has cornered the long end of the yield curve and artificially depressed long-term interest rates and artificially flattened the yield curve, bank lending has significantly lagged the
liquidity the Fed is attempting to inject into the real economy. The result has been that much of the Fed’s liquidity has been trapped within the financial markets and inflated financial assets rather than financing the expansion of the economy.
The Fed can only set the groundwork for incremental lending, but it cannot force banks to lend. The Fed’s data show banks have actually been more willing to lend, but their lending is not keeping up with the massive amounts of liquidity the Fed has attempted to inject into the economy. The banks’ risk premium associated with riskier lending is simply not large enough to incent broad-based lending.
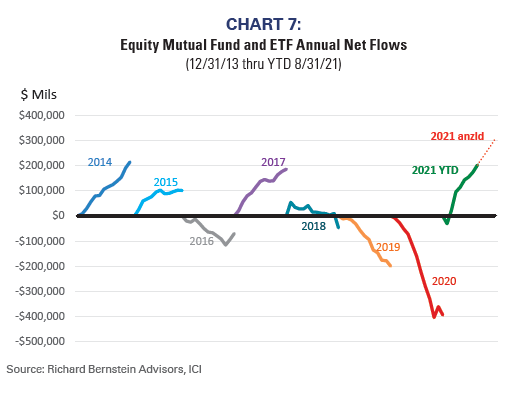
Chart 6 shows bank assets (i.e., lending) relative to the economy’s money growth, and the ratio of lending to liquidity has fallen to its lowest level in over 40 years. Chart 7 suggests the excess liquidity is flowing into stocks.
Hype leads to misallocated capital
Bubbles always result in a misallocation of capital. Investors overcapitalize sectors that are “hot”, but sectors of the economy that need capital tend to go hungry. It appears as though the current bubble is following that historical precedent.
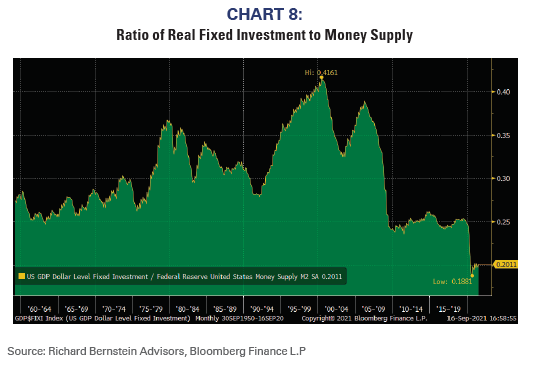
Chart 8 shows the ratio of real fixed investment to money supply. The Fed may be trying to grow the real economy via excessive money growth, but so far real investment is lagging the growth in the money supply by an historic amount.
Whereas investors are hyped about innovation, disruption, and visions of the future, many industries today are being starved for capital and are significantly underinvesting. Previous under- investment has already resulted in shortages and production
bottlenecks in some sectors. One might expect such conditions to last longer than investors currently expect because of the sectors’ ongoing underinvestment.
Bubbles create investment opportunities in virtually everything outside the bubble
Perhaps the number one rule of investing is return on investment is highest when capital is scarce. In other words, one should want to be the sole banker in a town of 1,000 borrowers because that one banker will determine the terms and the profitability of every loan. If there are 1,000 bankers and one borrower, then the borrower will get the banks to bid against each other. It’s simple supply and demand for capital that ultimately determines expected returns.
Bubble investors often believe the hype and hot stories about future growth but ignore the valuation of the assets and ultimately over- estimate their expected returns. Asset valuations and not hype determine investment returns regardless of economic development.
For example, there were many stories during the Technology Bubble regarding new technologies changing the economy. Many of those stories came true during the decade after the bubble, but the Technology sector was the worst performing S&P 500® sector and provided negative absolute returns during the decade. (See Chart 9).
The financial markets appear to be at another opportunity similar to that in 1999/2000 in that many sectors around the world outside of the bubble seem attractive. In particular, we favor assets and sectors that outperform as nominal growth accelerates: energy, materials, industrials, smaller capitalization stocks both within and outside the US, non-China emerging markets, lower quality bonds, and commodities/gold.
Investors become very myopic during bubbles, and believe there is little in which to invest other than the bubble assets. To us, such situations present tremendous and broad investment opportunities in sectors that are being relatively denied capital.
Don’t miss out on future RBA Insights: jump.rbadvisors.com/ subscribe
To learn more about RBA’s disciplined approach to macro investing, please contact your local RBA representative.
INDEX DESCRIPTIONS:
The following descriptions, while believed to be accurate, are in some cases abbreviated versions of more detailed or comprehensive definitions available from the sponsors or originators of the respective indices. Anyone interested in such further details is free to consult each such sponsor’s or originator’s website.
The past performance of an index is not a guarantee of future results.
Each index reflects an unmanaged universe of securities without any deduction for advisory fees or other expenses that would reduce actual returns, as
well as the reinvestment of all income and dividends. An actual investment in the securities included in the index would require an investor to incur transaction costs, which would lower the performance results. Indices are not actively managed and investors cannot invest directly in the indices.
S&P 500®: The S&P 500® Index is an unmanaged, capitalization-weighted index designed to measure the performance of the broad US economy through changes in the aggregate market value of 500 stocks representing all major industries.
Sector/Industries: Sector/industry references in this report are in accordance with the Global Industry Classification Standard
About Richard Bernstein Advisors
Richard Bernstein Advisors LLC is an investment manager focusing on long-only, global equity and asset allocation investment strategies. RBA runs ETF asset allocation SMA portfolios at leading wirehouses, independent broker/dealers, TAMPS and on select RIA platforms.
Additionally, RBA partners with several firms including Eaton Vance Corporation and First Trust Portfolios LP, and currently has $15.1 billion collectively under management and advisement as of August 31st, 2021. RBA acts as sub‐advisor for the Eaton Vance Richard Bernstein Equity Strategy Fund, the Eaton Vance Richard Bernstein All‐Asset Strategy Fund and also offers income and unique theme‐oriented unit trusts through First Trust. RBA is also the index provider for the First Trust RBA American Industrial Renaissance® ETF. RBA’s investment insights as well as further information about the firm and products can be found at www.RBAdvisors.com.
Nothing contained herein constitutes tax, legal, insurance or investment advice, or the recommendation of or an offer to sell, or the solicitation of an offer to buy or invest in any investment product, vehicle, service or instrument. Such an offer or solicitation may only be made by delivery to a prospective investor of formal offering materials, including subscription or account documents or forms, which include detailed discussions of the terms of the respective product, vehicle, service or instrument, including the principal risk factors that might impact such a purchase or investment, and which should be reviewed carefully by any such investor before making the decision to invest. RBA information may include statements concerning financial market trends and/or individual stocks, and are based on current market conditions, which will fluctuate and may be superseded by subsequent market events or for other reasons. Historic market trends are not reliable indicators of actual future market behavior or future performance of any particular investment which may differ materially,
and should not be relied upon as such. The investment strategy and broad themes discussed herein may be inappropriate for investors depending on their specific investment objectives and financial situation. Information contained in the material has been obtained from sources believed to be reliable, but not guaranteed. You should note that the materials are provided “as is” without any express or implied warranties. Past performance is not a guarantee of future results. All investments involve a degree of risk, including the risk of loss. No part of RBA’s materials may be reproduced in any form, or referred to in any other publication, without express written permission from RBA. Links to appearances and articles by Richard Bernstein, whether in the press, on television or otherwise, are provided for informational purposes only and in no way should be considered a recommendation of any particular investment product, vehicle, service or instrument or the rendering of investment advice, which must always be evaluated by a prospective investor in consultation with his or her own financial adviser and in light of his or her own circumstances,
including the investor’s investment horizon, appetite for risk, and ability to withstand a potential loss
of some or all of an investment’s value. Investing is subject to market risks. Investors acknowledge and accept the potential loss of some or all of an investment’s value. Views represented are subject to change at the sole discretion of Richard Bernstein Advisors LLC. Richard Bernstein Advisors LLC does not undertake to advise you of any changes in the views expressed herein.
© Copyright 2021 Richard Bernstein Advisors LLC. All rights reserved. PAST PERFORMANCE IS NO GUARANTEE OF FUTURE RESULTS