
All Clear? – Judge the Quality of the Bounce
By Doug Sandler, Chris Konstantinos & Rod Smyth, RiverFront Investment Group
In our Balanced Portfolios, RiverFront went into the October correction with a small bias in favor of stocks (no significant US/Non-US bias) and some cash; funded by a bias against bonds. That continues to be our position as stock markets around the world have risen in November. Our positioning is constructive because:
- Our strategic (Price Matters®) processes still favor stocks over bonds
- We think global earnings will continue to grow in both 2019 and 2020 allowing stocks to potentially deliver better returns than bonds for the next 12-15 months
Our stock overweight is small because:
- Our technical assessment is cautious
- The Fed is raising interest rates and there is a lot of uncertainty about how high rates will go before the Fed feels it has done enough
Technical view: judge the quality of the bounce
Following a significant correction (10-20%), especially one which flattens or inverts the primary trend (200-day moving average), our mantra is “judge the quality of the bounce”. Bull markets have corrections, most of which are just a resetting of expectations before the bull market resumes. In our view, a healthy bull market is one which resumes relatively quickly with a strong bounce that recovers 2/3rds of the recent decline. A bounce which fails to recover one third of the recent decline is a technical red flag, in our view.
The S&P 500 index, which had the strongest trend among major world markets going into October, fell around 10% in this correction – enough to flatten the trend. We believe the index needs to break back decisively above 2,850 to signal a technical ‘all clear’. Our view is that it will. However, we would be concerned if there is a re-assertion of October’s downtrend – a “weak” bounce. We believe last week’s election result which was in line with consensus, played only a minor role in the markets’ weakness over the last six weeks. In our view, the correction was triggered more by a reassessment of how high the Federal Reserve may raise interest rates, prompted by comments from Chairman Powell. The bounce, which started the previous week, seemed to be boosted by traders who had positioned for a Democratic sweep closing those positions.
As we have discussed in many recent Weekly Views, the strategic story for non-US stocks is more compelling, but the technical situation is worse. Using the MSCI World ex US index, stocks peaked in January and at the October low were down 20% from that peak, in a pattern of lower highs and lower lows. Bounces along the way have consistently failed our quality test, prompting us to reduce our allocation over the last six months. We believe non-US stocks need to rise another 8-10% to break the downtrend and restore a healthy technical situation.
Balancing Value and Momentum
We believe balancing the merits of value and momentum is the ‘art’ side of what RiverFront tries to do. Our processes for identifying relative value in asset classes, by studying price history, business fundamentals and macro trends is quantitative by necessity. There is a tremendous amount of data to analyze and we are constantly trying to discern how and whether this information affects financial markets. We are at our most confident when our judgment of value aligns with price momentum as it did for most of 2017. However, value is in the eye of the beholder. Legendary British economist John Maynard Keynes wryly observed that “the crowd can be irrational, longer than you can remain solvent”. He ran the Cambridge University endowment in the 1920’s and 1930’s and often watched stocks he regarded as cheap, get a lot cheaper before they bottomed and stocks he regarded as expensive continue to rise before they peaked. He asked for and got a long-term mandate which he believed was the key to his success as one of the first great value investors. Like Keynes, value drives a lot of our long-term strategic process, and we also heed his advice on “the crowd” by respecting price momentum as part of our tactical process.
Past performance is not a guarantee of future results. Shown for illustrative purposes only. Not indicative of RiverFront portfolio performance.
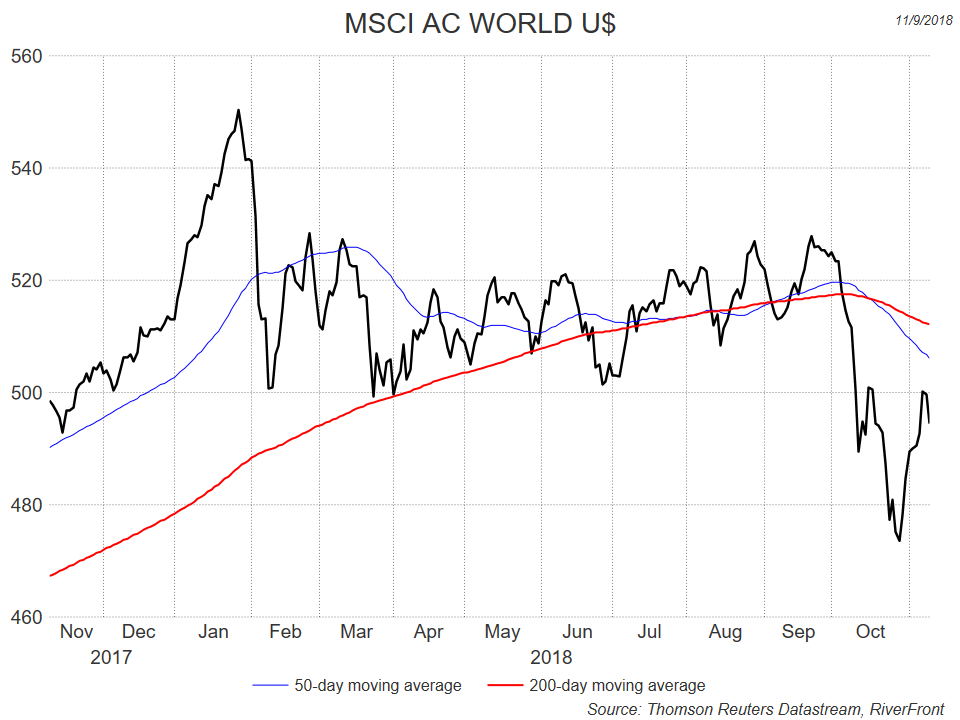
Our chart shows the MSCI World Stock index over the last year, with its 50 and 200-day moving averages. For six months from March to September, this index traded in a range above the February lows, but below the January highs as investors digested both the good news of strong earnings and the worries about global trade and the magnitude of potential US interest rate hikes. At the end of the summer, it looked as though an upside breakout was more likely, but October’s correction caused the index to break decisively below the bottom of the range, and both moving averages to turn down. So far, the bounce has re-traced about half of the decline, and has so far been unable to break back above the falling moving averages. Investors are trying to assess what 2019 will bring, and in aggregate they are clearly cautious. As discussed above, our fundamental outlook is more hopeful. We believe that ultimately, fundamentals determine price trends, but we are very aware that the technical message is telling us not to overplay our hand.
Doug Sandler, CFA, is Global Strategist; Chris Konstantinos, CFA, is Chief Investment Strategist; and Rod Smyth is Director of Investments at RiverFront Investment Group, a participant in the ETF Strategist Channel.
Important Disclosure Information
Diversification does not ensure a profit or protect against a loss.
Past results are no guarantee of future results and no representation is made that a client will or is likely to achieve positive returns, avoid losses, or experience returns similar to those shown or experienced in the past.
The comments above refer generally to financial markets and not RiverFront portfolios or any related performance.