

We are in the longest U.S. economic expansion in modern history.
Barring a black swan of epic proportions this month, the U.S. economy will break the record in June for the longest expansion since 1854. The current leader, which is soon to be surpassed, is the 1990’s economic expansion, which lasted for 10 years. Is this a cause for a celebration, or is the economy due for a downturn?
Economic expansions don’t die of old age. Just because the expansion has lasted this long doesn’t mean it should end. In fact, there are many positive indicators of why this expansion should continue. Private-sector balance sheets remain strong, as financial assets and home prices are near all-time highs. The labor market is solid – the U.S. unemployment rate stands at 3.6%, just 0.2% from its all-time low. Inflation remains subdued and serves as a tailwind to the economy, as the Federal Reserve has not moved to tighten conditions.
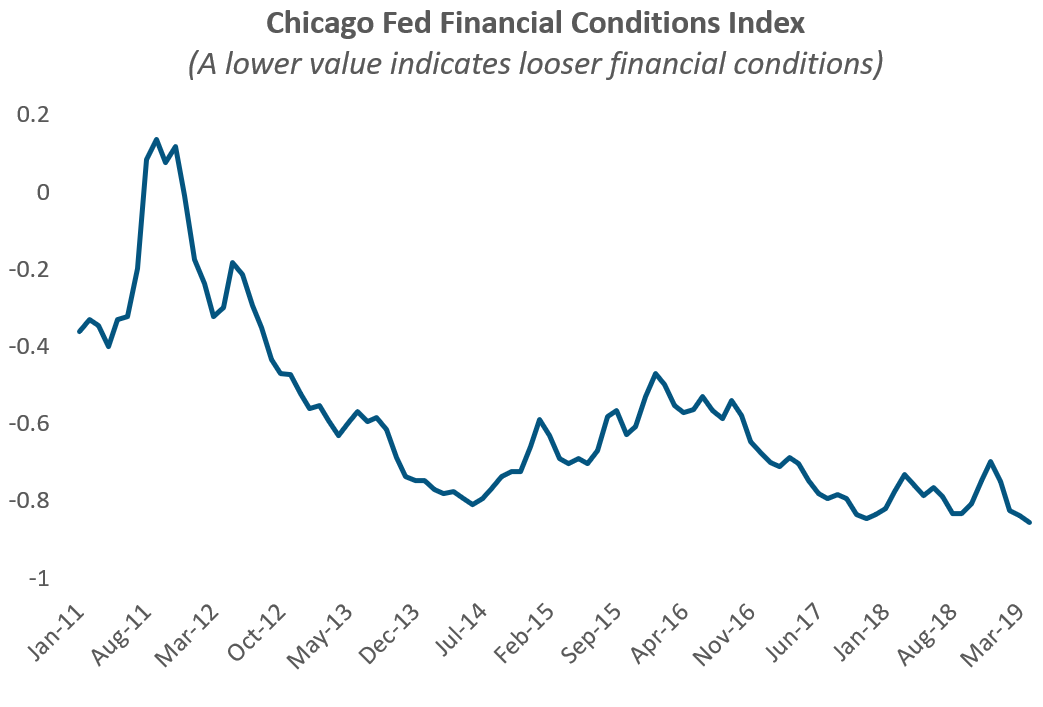
An additional positive indicator, the Chicago Fed’s National Financial Conditions Index, which indicates conditions in debt, equity, and “shadow” banking systems, illustrates that financial conditions are at their easiest levels post-crisis.
However, we’re starting to see initial signs that the economy could be softening. While we don’t believe these indicators point to an imminent recession, the economy is experiencing a material slowdown that warrants observation for the remainder of the year.
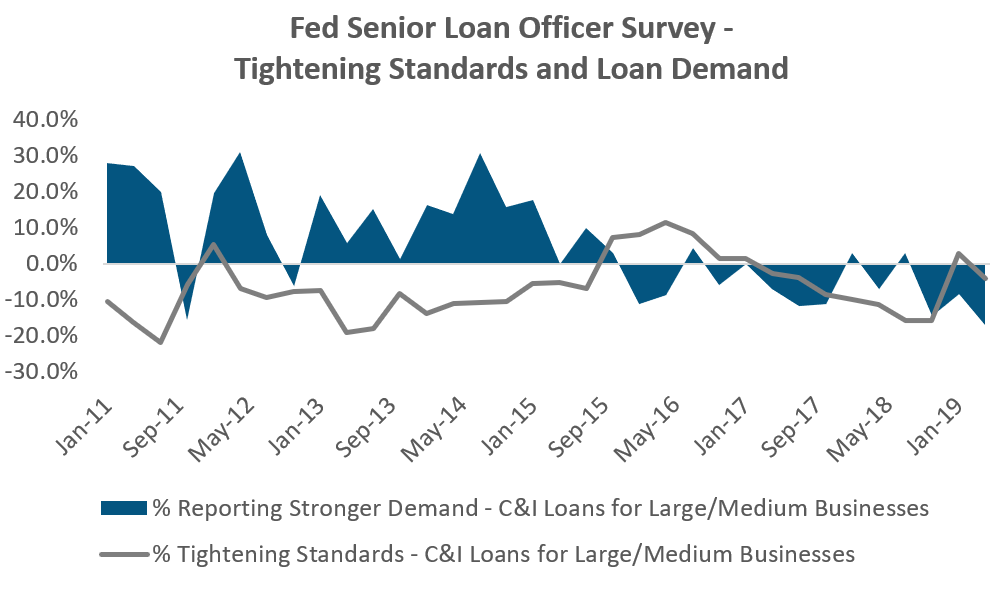
1) Business Loan Activity
The Federal Reserve’s Senior Loan Officer Survey’s measure of business loan activities points to moderation in business investment. The percentage of loan officers reporting stronger demand are the lowest in the post-crisis period, while loan standards have moved tighter since the second half of 2018.
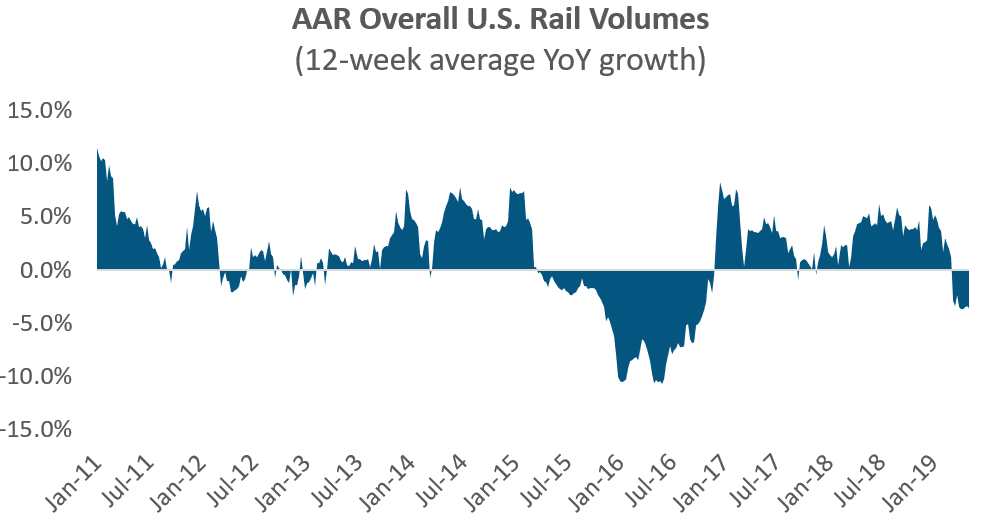
 2. Transport Volume
Key transportation indicators have turned negative. The Association of American Railroads has reported a slowing in U.S. rail traffic volumes, with total volumes falling in the first 17 out of 19 weeks in 2019.
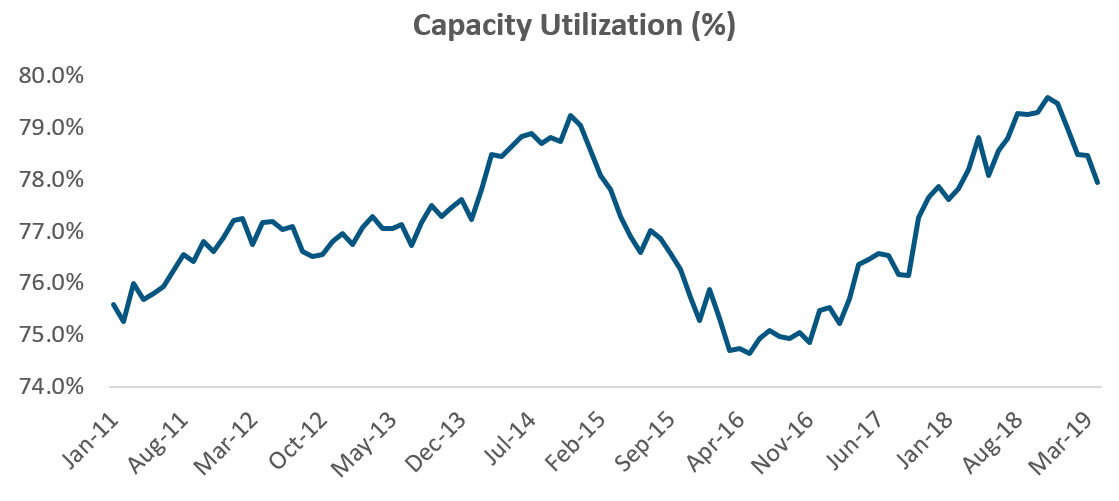
3.Industrial Output
Capacity Utilization, which measures the percentage of realized potential industrial output and economic slack, has been declining since its peak in October 2018 and is at a 14-month low.
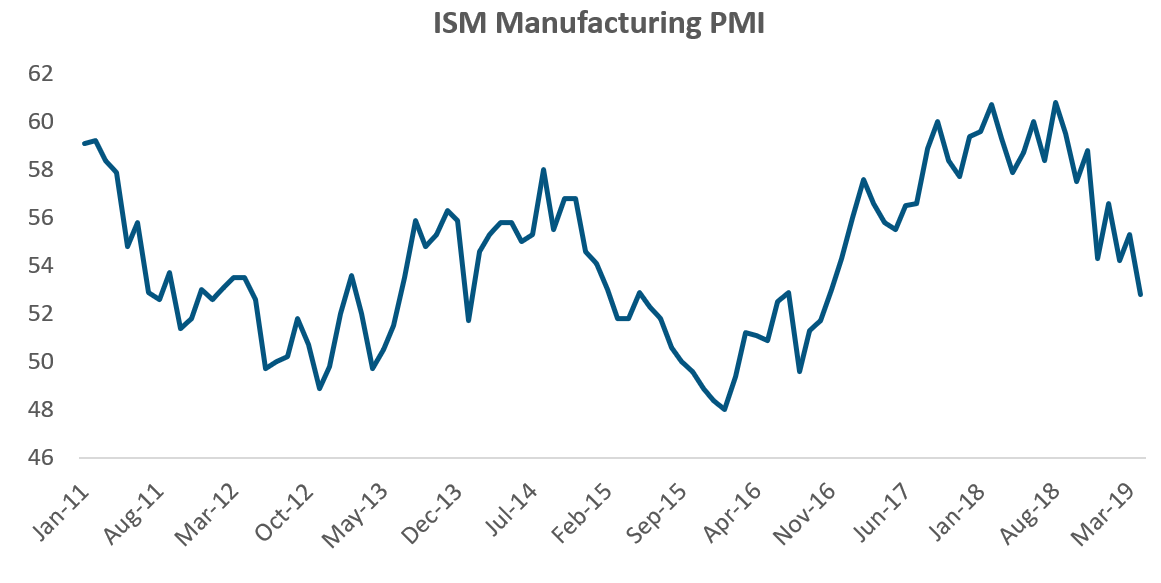
4. Manufacturing Demand
The widely followed ISM Manufacturing Purchasing Manager’s Index (PMI), which surveys purchasing managers at over 300 manufacturing firms, has moved sharply lower in recent months. A PMI index above 50 indicates an expanding economy, and a move below 50 indicates a contraction. While the indicator stands in expansionary territory at 52.5, it has declined from its peak in August 2018 of 60.8. A sustained move below 50 would signal a serious slowdown, if not a recession; however, we are not there yet.
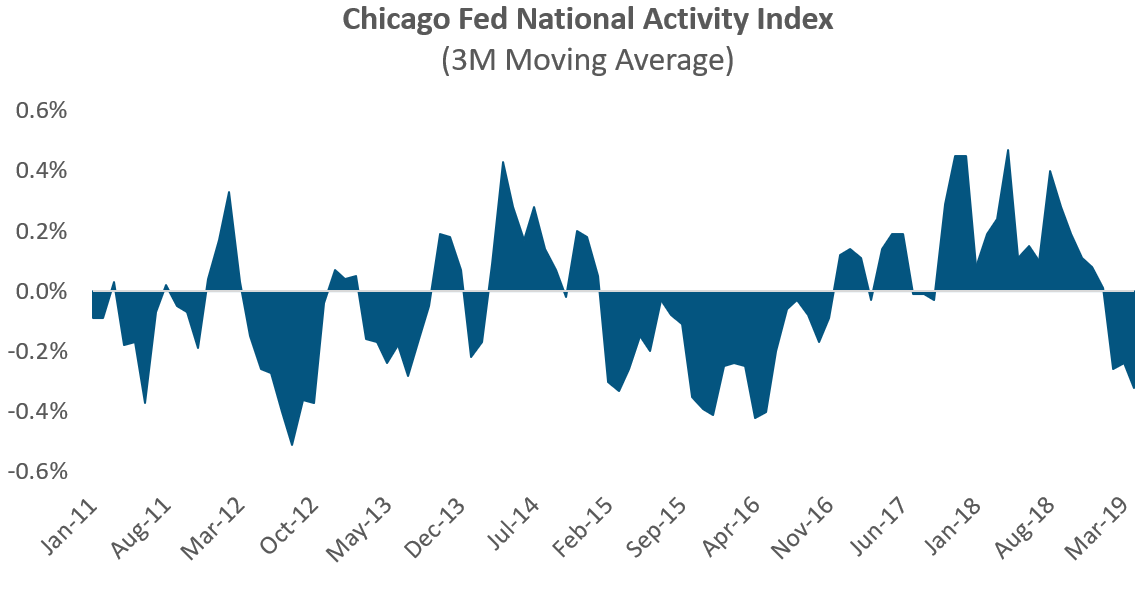
5. Economic Activity
The Chicago Fed’s National Activity Index, which is a composite of 85 indicators of national economic activity, has turned lower and points to below-trend growth in recent months.
As the U.S. economy moves into its longest expansion in modern history, we are seeing signs of a slowdown bubbling under the sanguine labor market and easy financial conditions. Whether the dip is transitory, as it was in 2016, or a herald of a larger slowdown remains to be seen. It all depends on the outlook for monetary and fiscal policy, as well as a potential fallout from slowing global trade.
This article was written by the team at Sage Advisory, a participant in the ETF Strategist Channel.
Disclosures: This is for informational purposes only and is not intended as investment advice or an offer or solicitation with respect to the purchase or sale of any security, strategy or investment product. Although the statements of fact, information, charts, analysis and data in this report have been obtained from, and are based upon, sources Sage believes to be reliable, we do not guarantee their accuracy, and the underlying information, data, figures and publicly available information has not been verified or audited for accuracy or completeness by Sage. Additionally, we do not represent that the information, data, analysis and charts are accurate or complete, and as such should not be relied upon as such. All results included in this report constitute Sage’s opinions as of the date of this report and are subject to change without notice due to various factors, such as market conditions. Investors should make their own decisions on investment strategies based on their specific investment objectives and financial circumstances. All investments contain risk and may lose value. Past performance is not a guarantee of future results.
Sage Advisory Services, Ltd. Co. is a registered investment adviser that provides investment management services for a variety of institutions and high net worth individuals. For additional information on Sage and its investment management services, please view our web site at www.sageadvisory.com, or refer to our Form ADV, which is available upon request by calling 512.327.5530.