
Nasdaq Posts Best January Since 2001
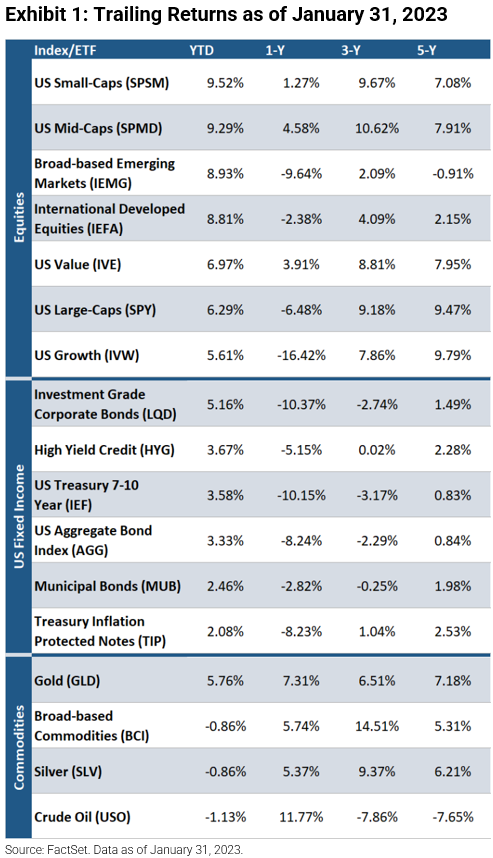
Amid abating interest rate hike fears and inflation concerns, equities were up in January as the Nasdaq gained 10.7%, marking its best January since 2001. US small-caps were among the best performers (+9.5%), followed by US mid-caps (+9.3%), and broad-based emerging market equities (+8.9%). Bonds also posted gains as investment grade corporates increased 5.2%, high yield credits rose 3.7%, and 7-10 year US Treasuries were up 3.6%. Aside from gold (+5.8%), commodities produced negative returns as crude oil fell 1.1%, silver declined 0.9%, and broad-based commodities were down 0.9%.
Despite Expected Quarter Percentage Point Hike, Fed Likely to Maintain Hawkish Tone
At the upcoming February FOMC meeting, the Federal Reserve is expected to raise interest rates by 25 bps, a slightly higher hike of 50 bps at the December meeting. The modest rate increase would come after inflation continued to soften given December CPI (Consumer Price Index) and PPI (Producer Price Index) prints released earlier this month. The hike would leave the federal funds rate at the 4.50–4.75% range, only 50 bps short of the expected 5.00-5.25% terminal range. However, according to the CME FEDWatch tool, traders are only pricing in two more 25 bps hikes: one at both the February and March meetings, followed by a much-anticipated pause. Though markets are bullish, they are also expecting that Chairman Jerome Powell will have a hawkish tone, supporting the Fed’s stance. From the December meeting minutes, policymakers emphasized “ongoing increases” until the appropriate level is reached to get inflation back down to the 2% target. The minutes also stressed that stimulating financial markets could “complicate the Committee’s effort to restore price stability,” giving Powell more of a reason to push back against the recent rally.
Will 2023 be a Positive Year for Stocks?
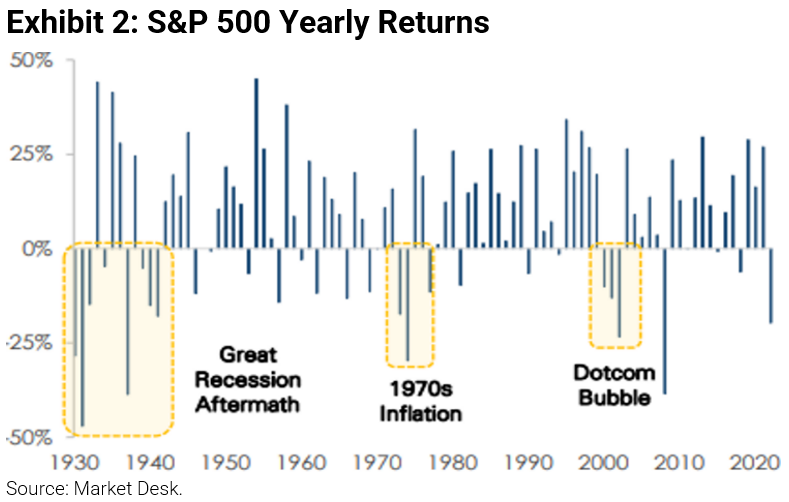
Despite 2022’s selloff and looming recession signals seen in 2023, past performance suggests that back-to-back yearly negative returns in the S&P 500 are rare.
Earnings Project Risks to the Labor Market
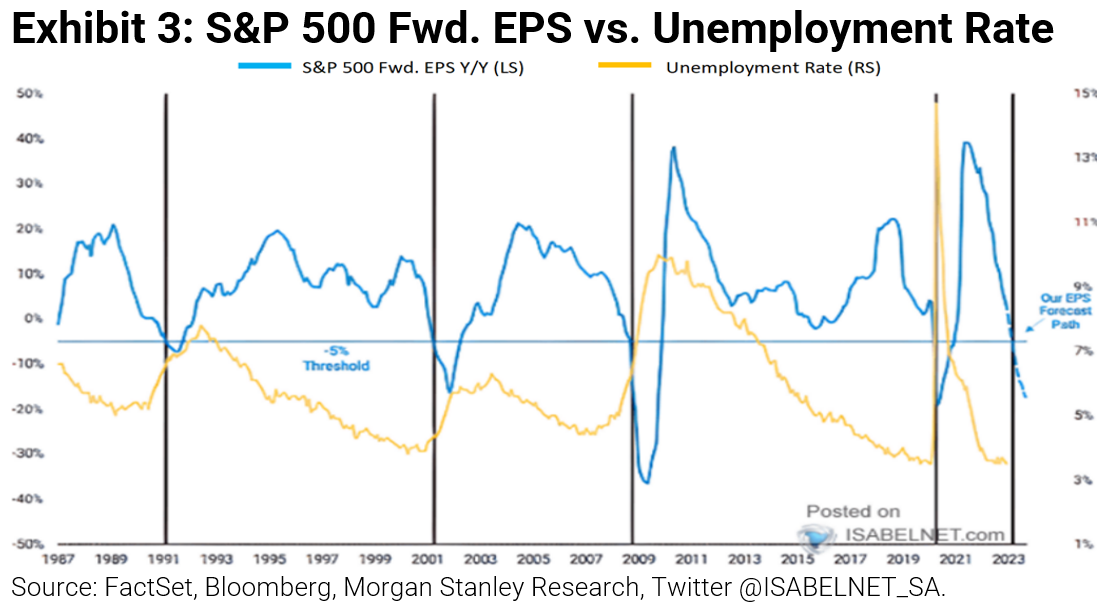
If earnings fall to levels below the -5% threshold as forecasted by Bloomberg and Morgan Stanley, history implies layoffs may significantly increase.
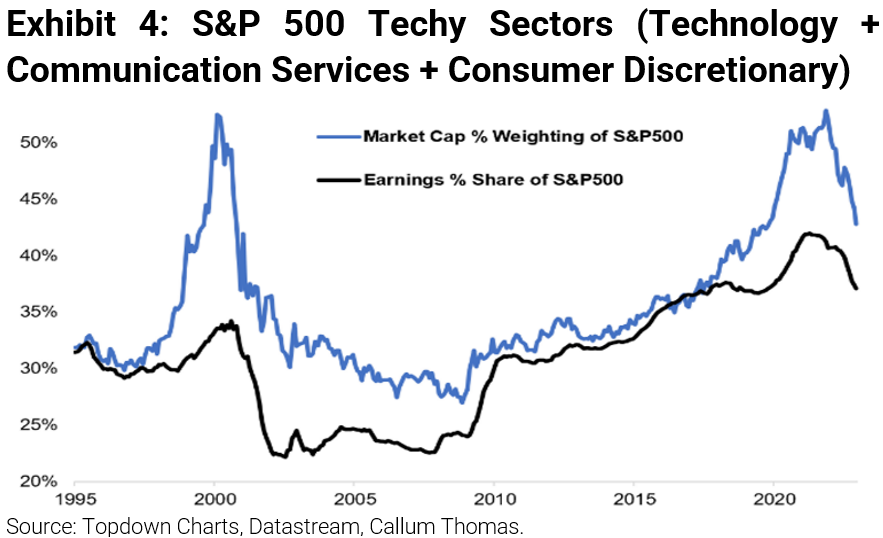
More Tech Unwinding Ahead?
As tech-oriented sectors faced a difficult environment in 2022 with elevated inflation and high interest rates, their combined weighting in the S&P 500 Index has come down from massive highs. Amid a macroeconomic outlook that remains challenging for these sectors, is there more unwinding to come?
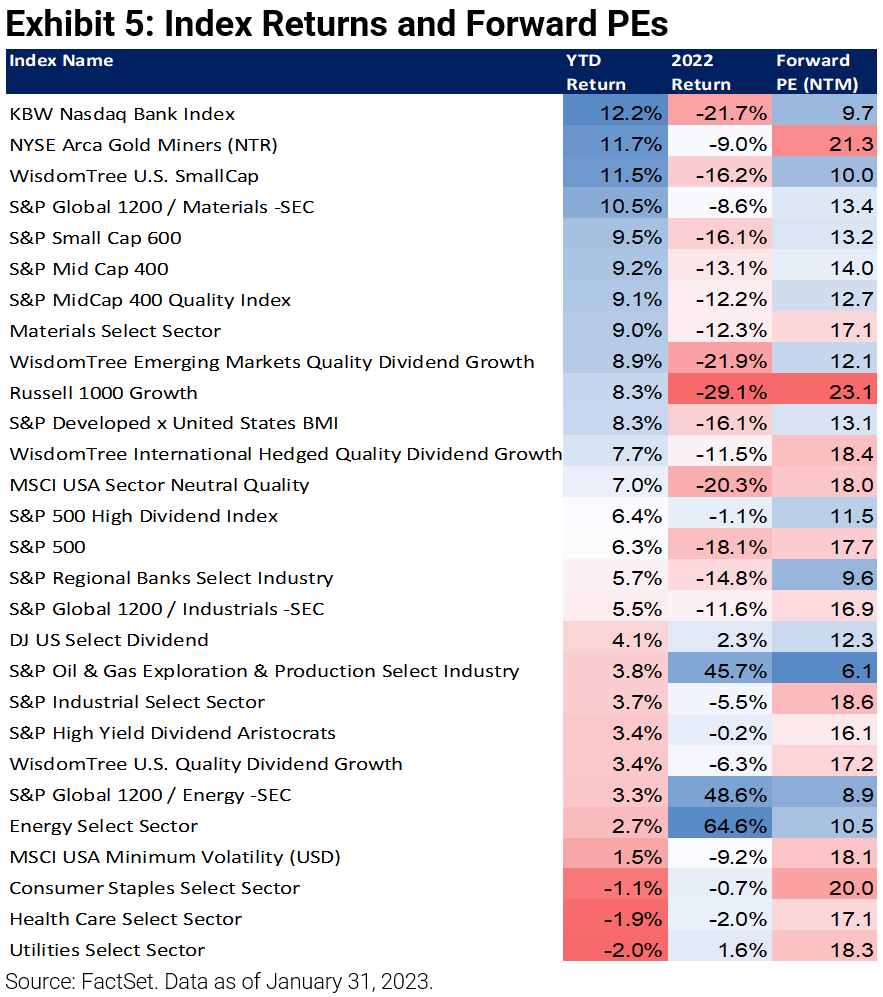
2022’s Losers Outperforming in 2023? Don’t be Fooled by this Rally
Through January, many of 2022’s losers are outperforming in 2023. This can likely be attributed to the January Effect, where investors buy back losing positions that were sold in the late months of the previous year for tax loss-harvesting purposes. We believe this, along with short covering, is causing a mean reversion in the market that may not be sustainable. It is hard to be constructive when leading economic indicators continue to roll over. Moreover, economic turnovers have historically occurred after the Fed pauses, which proposes that the economy may experience more hardship in the months to come. Don’t be fooled by this rally. When looking at forward PE Ratios, growth stocks (while having their valuations compressed) remain expensive. The same goes for high quality and defensive equities (although these typically stay expensive as the cycle turns south). Banks, energy, inflation-linked assets, small-caps, mid-caps, emerging markets, and international developed equities are all offering investors a notable valuation discount compared to the US market. US large-cap index beta had approximately a 1 Sharpe Ratio in the 2010-2020 period. We believe that likely won’t repeat again in the next decade. Our view is that as long as the terminal rate stays high, value should outperform growth. Our preference is to tilt away from US index, growth, and defensives, and towards value, small/mid-cap, and Non-US.
For more news, information, and analysis, visit the ETF Strategist Channel.
Warranties & Disclaimers
As of the time of this publication, Astoria Portfolio Advisors held positions in IEMG, IVE, SPMD, SPY, SPSM, IVW, IEFA, MUB, TIP, AGG, IEF, HYG, LQD, BCI, GLD, USO, and SLV on behalf of its clients. There are no warranties implied. Past performance is not indicative of future results. Information presented herein is for educational purposes only and does not intend to make an offer or solicitation for the sale or purchase of any specific securities, investments, or investment strategies. Investments involve risk and, unless otherwise stated, are not guaranteed. The returns in this report are based on data from frequently used indices and ETFs. This information contained herein has been prepared by Astoria Portfolio Advisors LLC on the basis of publicly available information, internally developed data, and other third-party sources believed to be reliable. Astoria Portfolio Advisors LLC has not sought to independently verify information obtained from public and third-party sources and makes no representations or warranties as to the accuracy, completeness, or reliability of such information. Astoria Portfolio Advisors LLC is a registered investment adviser located in New York. Astoria Portfolio Advisors LLC may only transact business in those states in which it is registered or qualifies for an exemption or exclusion from registration requirements.