
Revenue Changes
Due to market downturns, the overall US ETF assets decreased slightly in 2018 by 1.23%. With flows toward many short duration bond funds and low-cost beta ETFs, the forward-looking issuer revenue projections also dropped from the 2017 high of $7.53 billion to a 2018 low of $6.83 billion. Despite the difficulties posed by the markets, 2018 presented great opportunities for active ETFs. Active ETFs now represent over 5% of the expense ratio revenue generated by ETF issuers, which is a 46% increase. Non-traditional index-based ETFs also increased market share by over 7%. These changes illustrate how the industry adopts to difficult markets and price competition. Access to differentiated solutions packaged in the ETF wrapper is at the core of our optimism for the industry. The combined growth of market share by Non-Traditional and Active Managed from 37.3% to 41.49% may surprise some people, but not us. Growth in market share in the fixed income category and alternative category reflects market dynamics. Growth in the ETF market may not be linear, but we would also highlight that it’s not limited to just AUM. Service providers and liquidity providers will see benefits as the pie gets bigger and more investors embrace the benefits of the ETF wrapper.
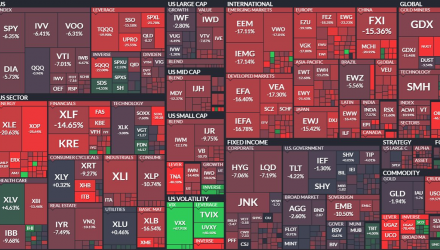
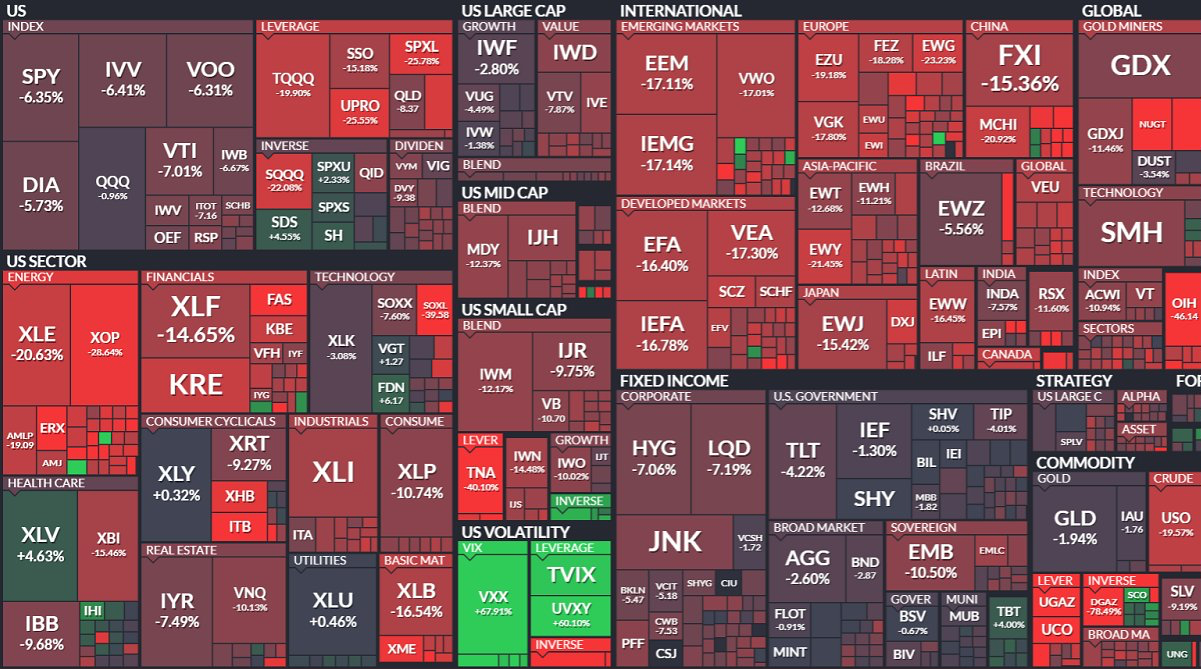
A Sea of Red
Despite $316 billion in net inflows, the assets of the ETF industry decreased from a $3.5 to $3.4 trillion in 2018 in the United States. Additionally, the average weighted expense ratio for US ETFs dropped from 22bps to 20bps, which represents 9% reduction in projected revenue from ETF issuers. ETF assets decreased slightly due to negative performance from almost every ETF. The chart below shared by Nate Geraci illustrates how difficult 2018 was for most ETFs.
The Big Picture
The number of ETFs in the US increased in 2018 by about 1.9% to 2,157. Compared to 2017, the number of ETFs launched decreased by 17% and the number of ETFs closed increased by 38%. The 2018 open to close ratio was a healthy 1.22, meaning for every 1.22 ETFs launched, 1 closed. ETF ownership influence also increased significantly from 6.97% in 2017 to 8.23% by the end of 2018. Although 2018 marked a slight increase in listing, the volatile markets marked the end for many ETFs that were not raising assets. ETFs will always reflect pure capitalism, and while the ownership influence is likely to rise in the equity market in the future, the need for a proper launch strategy is becoming increasingly more important. The days of “Build it and they will come” are no longer.
An Unstoppable Trend
The ETF industry increased listings, diversified revenue, and recorded the 2nd highest flows in history in 2018. The industry also recorded more closings and less revenue from assets. For the TETF.index team, the lesson from 2018 is that ETFs are resilient and provide a simple access point for investors in these dynamic markets. In a year plagued with challenges from the markets, ETFs still found new assets and investors seeking to embrace the client alignment growth factors of the ETF structure. In 2019, we expect more fiduciaries to look for ETFs as differentiated solutions while also continuing to lower their client investment costs.
This article was written by the team at Toroso Asset Management, a participant in the ETF Strategist Channel.
Click here to see disclosures.