

By Barbara Velado, Analyst, Research & Design, ESG Indices, S&P Dow Jones Indices
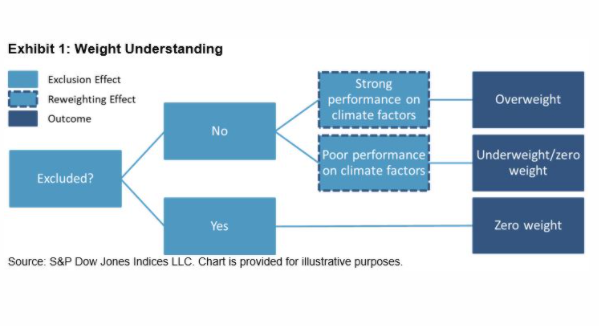
In April 2020, we launched the S&P PACTTM (Paris-Aligned Climate Transition) Indices. The indices aim to align with a 1.5oC climate scenario, the EU’s minimum standards for EU Climate Transition Benchmarks and EU Paris-Aligned Benchmarks, and the recommendations of the Task Force on Climate-related Financial Disclosures (TCFD), while maintaining a broad, diversified exposure. The S&P PACT Indices consist of the S&P Paris-Aligned (PA) Climate Indices and S&P Climate Transition (CT) Indices. The index methodology excludes certain companies (exclusion effect), then reweights remaining constituents (reweighting effect) based on their climate performance (see Exhibit 1), as discussed in a previous blog.
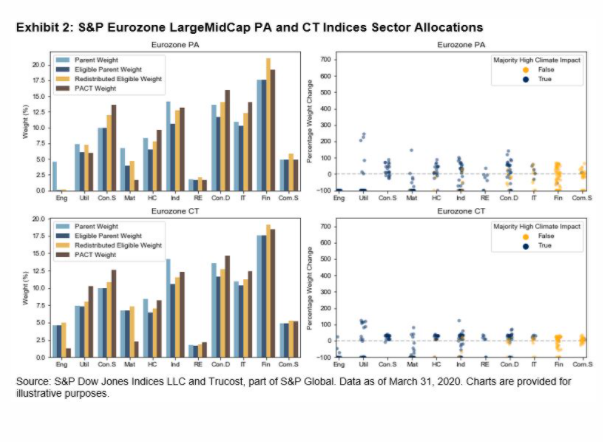
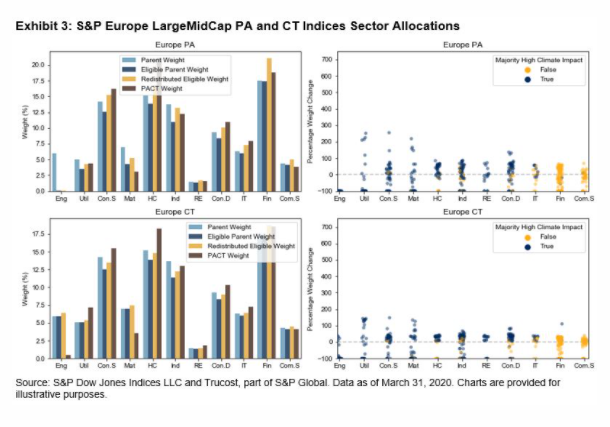
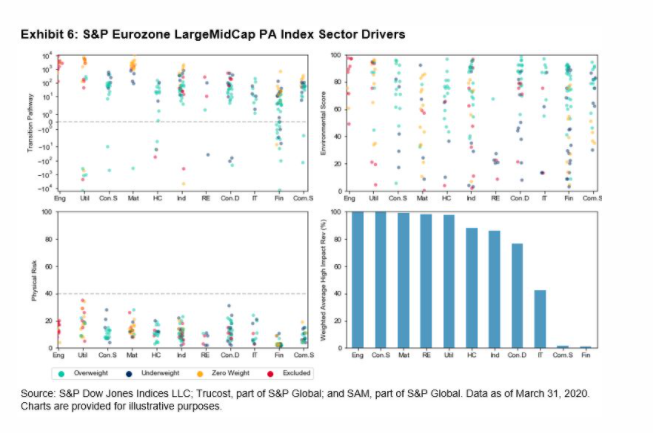
We published a paper explaining the weight attribution of constituents in the S&P PACT Indices, where we isolated the transition pathway, environmental score, physical risk, and level of high climate impact revenue as important weight drivers. In this blog, we assess how sector allocations (see Exhibit 2) are driven by the climate factors and exclusions listed above within the S&P Eurozone PACT and the S&P Europe PACT Indices.
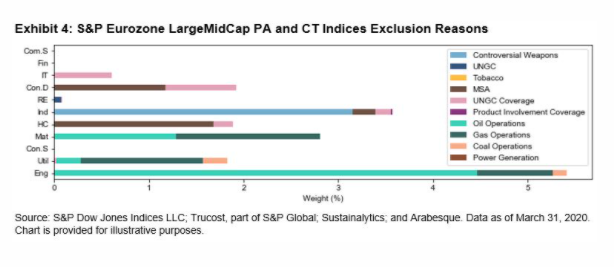
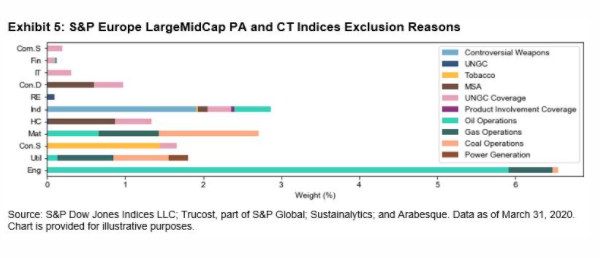
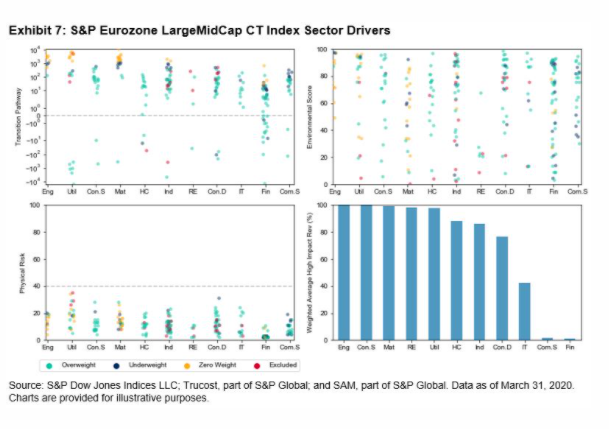
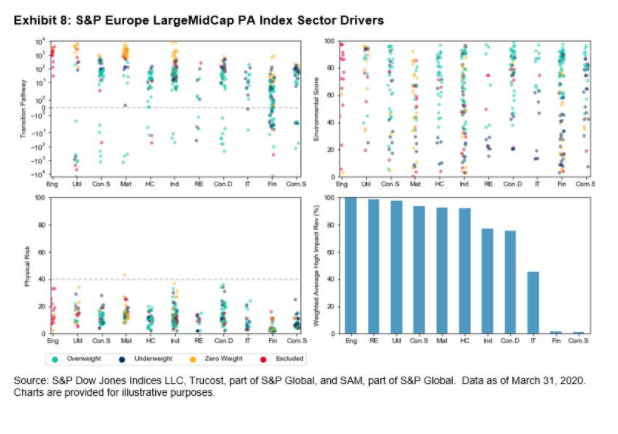
The Energy sector was allocated zero weight in the S&P Eurozone LargeMidCap PA Climate Index and the S&P Europe LargeMidCap PA Climate Index, largely due to the methodology’s exclusion of companies that participate in oil operations. Meanwhile, Energy companies were eligible, but still underweighted in the S&P Eurozone LargeMidCap CT Index and S&P Europe LargeMidCap CT Index, as all companies were misaligned with their 1.5oC budget (see Exhibits 7 and 9). Within the S&P Eurozone LargeMidCap CT Index, one Energy company was overweighted. This company showed a strong environmental score, low physical risk, and was the closest to the 1.5oC compatibility goal of all the Energy stocks. Within the S&P Europe LargeMidCap CT Index, another Energy company was overweighted—this was the second-closest stock to the 1.5oC compatibility requirement.
Unlike the S&P Europe LargeMidCap CT Index, no Utilities companies were excluded from the S&P Eurozone LargeMidCap CT Index due to power generation revenues, but many were excluded for gas operations in both indices (see Exhibits 4 and 5). Among the S&P PACT Indices in Europe and the Eurozone, Utilities received an underweight within the PA strategy, but an overweight within the CT series, largely due to differences in exclusion requirements. Energy and Utilities are generally considered among the highest-emitting sectors. Some Utilities companies are on a trajectory in line with the 1.5oC regulation, resulting in a vast weight improvement relative to Energy companies within the CT indices.
Financials was overweighted within the S&P Europe and Eurozone LargeMidCap PA and CT Indices. This is due to Financials being the largest sector within these indices—it was not affected by exclusions, which accounted for 16.5% of excluded weight from other sectors. If this weight is added to each constituent on a pro-rated basis (in line with the index’s objective function), then Financials would receive an overweight by having no excluded companies (represented by the yellow bars in Exhibit 2). We see that Financials receives less weight than a simple redistribution of eligible weight would suggest, due to Financials having a lower climate impact (see charts on the right in Exhibits 2 and 3). This reflects a positive redistribution effect overall, with the climate factors negatively affecting the weight of Financials in the indices.
Consumer Staples was strongly overweighted in both the S&P Eurozone LargeMidCap PA and CT Indices. This is likely due to there being no exclusions for the sector, as those companies are closer to their 1.5oC budget (below 102 as seen in Exhibits 6 and 7) and have high climate impact revenues.
We will follow up with another blog on the S&P 500 PACT and S&P Developed PACT Indices.

The posts on this blog are opinions, not advice. Please read our Disclaimers.
Originally published by Indexology Blog, 2/10/21