

By Matthew J Bartolini, CFA, Head of SPDR Americas Research; Colin J Ireland, CFA, Sales Execution and Institutional Strategy
Investors seeking to quickly reposition portfolios in 2020’s historically volatile market were limited by their ability to source liquidity. To meet their liquidity needs, investors of all types gravitated toward the centralized exchange trading and transparency of the ETF structure — creating deeper pools of liquidity for constrained markets and a much-needed buffer for the underlying securities. Analyzing ETFs’ record inflows and trading volumes provides a lens through which to consider how the use of ETFs will continue to increase in the future.
Volatility Spiked and ETF Trading Volumes Surged
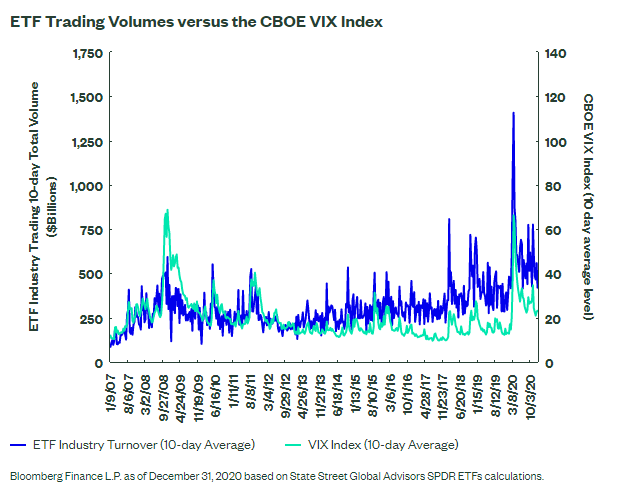
Over the past decade, we’ve seen a 60% correlation[1] of total ETF trading volumes to changes in the CBOE VIX Index (VIX). As volatility spiked in 2020, trading volumes surged, reaching a high daily watermark of $397 billion and notching seven days above the previous $268 billion record set in February 2018. This led to the most value ever traded over a 10-day period ($1.4 trillion) and record average daily volumes of $128 billion a day, 31% greater than 2018’s record of $98 billion,[2] as shown below. As a result, 2020’s full-year trading volume also set a record ($32 trillion), and the correlation between 10-day trading volumes and the VIX increased to 82% for the year.[3]
We also saw an increase in the share of the trading volume on US exchanges for ETFs in 2020. Over the past 15 years, as well as in a more recent five-year period, ETF trading volumes accounted for an average of 27% of all exchange volume. However, from February to April 2020 there were 36 consecutive trading days where ETF volumes represented more than 30% of tape volumes — the longest streak since the Global Financial Crisis. And ETFs peaking at 41% of exchange volume in early March[4] underscores how investors relied on ETFs to source liquidity and reposition portfolios during the worst of the pandemic-induced turmoil.
Sourcing Liquidity and Seeking Market Access
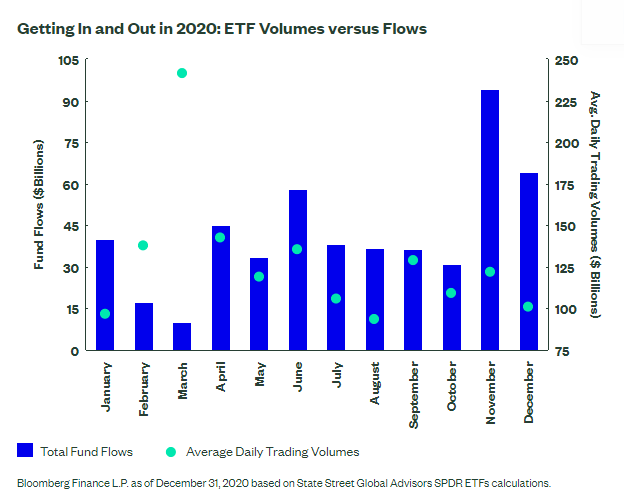
The uptick in ETF trading volume in 2020 extended beyond long only investors seeking to increase or decrease exposure to a particular asset class, geography or sector. As orders from different investors with varying objectives aggregated on exchange, deep pools of liquidity formed — allowing investors to efficiently transfer risk. As illustrated in the below chart, the times in which ETF trading volumes spiked during 2020’s volatility, overall flows often remained relatively muted. This spike in secondary trading relative to primary trading in March 2020 signals that investors met on exchange as many underlying markets were constrained, demonstrating how secondary ETF trading can provide additive liquidity benefits for investors.
Conversely, secondary market trading did translate to primary market activity in the final months of 2020 as election uncertainty dissipated and positive vaccine headlines shifted market sentiment. This helped push ETF flows to a full-year record $505 billion,[5] with November registering the most inflows for any month ever with over $90 billion — even though ranking sixth in monthly volumes.[6] This higher rate of primary market participation reflects investors using ETFs as tactical instruments to reposition portfolios and quickly obtain specific market access (e.g., risk-on recovery sectors).
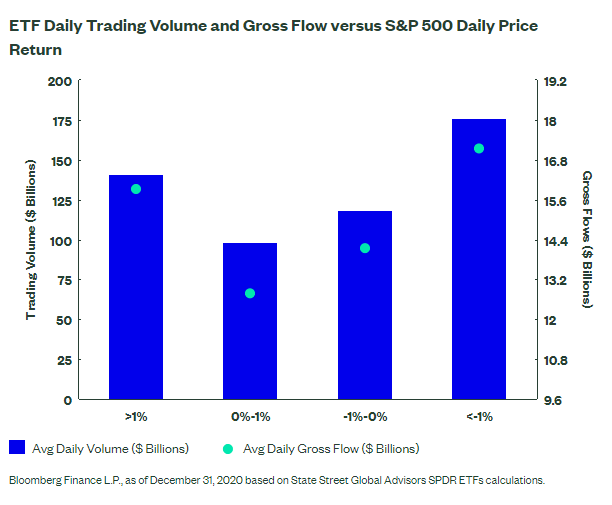
Breaking down volumes based on market movements furthers the notion of secondary market ETF trading providing additive liquidity benefits during periods of market stress. As shown below, breaking out volumes by daily price returns for the S&P 500 illustrates a volume smile trend — with higher volumes on both above and below +/-1% days (i.e., the big up and down days in 2020). Results are similar when dissecting ETFs by their intended objective and focus. For instance, volumes for sectors showed the same smile with volumes averaging over $20 billion when S&P 500 returns were above 1% or below -1%, compared to roughly $15 billion for all other days.[7] This 40% increase in activity reflects deepening liquidity pools – just when investors needed liquidity the most.
Expansion of the ETF Ecosystem
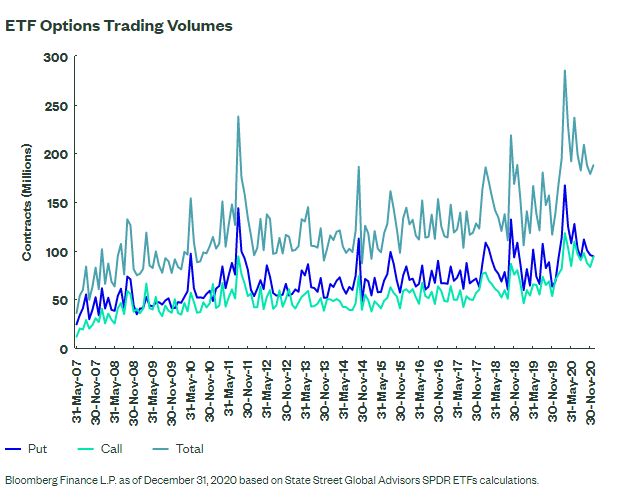
The rise in ETF volumes and trading efficiency relative to other vehicles is the result of many different investors utilizing the structure with independent objectives. For example, we saw the growth of ETF options, with listed ETF options volume hitting records in 2020, as shown below. These listed derivatives afford the buyers of these contracts the right but not the obligation to buy or sell the ETF at a specified price, and with a specified expiration date. With the uptick in options trading there was an increase in related ETF trading, often from options dealers/market makers seeking to hedge their risk exposure. Overall, more derivative usage increased liquidity for all investors due to the centralization of ETF trading on exchange.
Further highlighting the flexibility of ETFs, short interest reached a high watermark of $252 billion of total notional value of shares sold short. Using ETFs to short specific macro exposures, and potentially hedge portfolios, is a unique use of ETFs relative to other investment vehicles (i.e., mutual funds) and represents another type of specific investor adding to the total pool of trading volumes.[8] Overall, erratic markets made ETFs’ flexibility (long, short, or derivative use cases) a sought-after trait.
Greater Use of Fixed Income ETFs
With volatility high and information sparse, the average discount on fixed income ETFs across the industry naturally widened at the onset of the pandemic. But while discounts reached levels not seen since the Financial Crisis,[9] they quickly reverted to the mean as the underlying bonds began to trade. While some may believe these discounts represent a structural issue with fixed income ETFs, continuous ETF pricing provided much needed price discovery during periods in which the underlying market was liquidity constrained, as further discussed here .
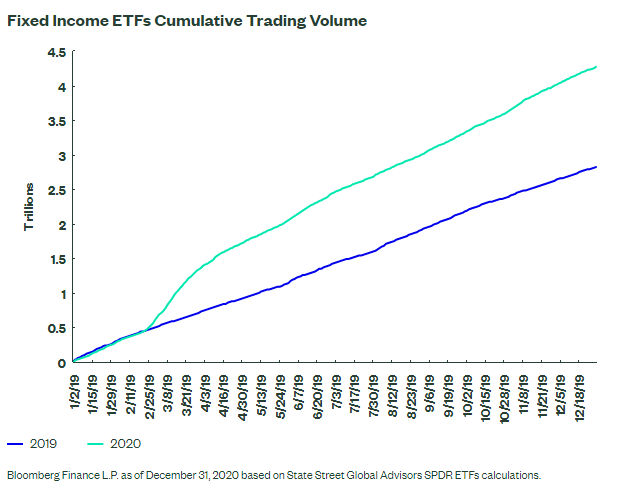
As they brought price transparency to an opaque market, fixed income ETFs traded record amounts in 2020 — ending at $4.3 trillion of total volume, 35% higher than in 2019, as shown below. While a sizable increase occurred in March/April, the average daily volume for the rest of 2020 was 30% higher ($14.4 billion to $11 billion)[10] than over the same calendar period in 2019.
In short, investors continued use of fixed income ETFs throughout 2020 affirmed that the discounts witnessed were, in fact, a valuable positive byproduct (price discovery/liquidity) of the vehicle’s structure, not a deficiency.
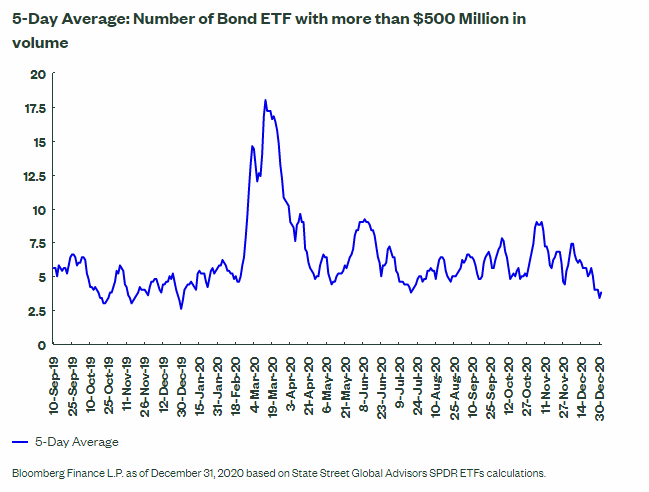
The depth of the liquidity throughout the bond ETF market also increased in 2020; on one day, nearly 20 fixed income ETFs each traded more than $500 million (i.e., the increase in trading volumes was not from just one big fund but from many funds). As the chart below shows, after that March spike, levels remained above pre-pandemic levels — approaching an average of 10 funds per day in May and November. While $500 million was used for this example, if the bar was set to $100 or even just $10 million, the number of funds jumping over that level in 2020 also would surpass pre-pandemic figures.
Fixed income ETFs also allowed investors to tactically seek market access as a result of a change in sentiment. Following the Federal Reserve’s (Fed) policy actions on March 23, aimed at calming market stress, investment-grade and high yield ETF flows over the next few months were the most ever over any 60-day period, as show below. This coincided with credit spreads declining by over 500 basis points in the spring of 2020.[11] Overall, these flows reflect tactical investor positioning alongside a supportive policy environment favoring risk assets.
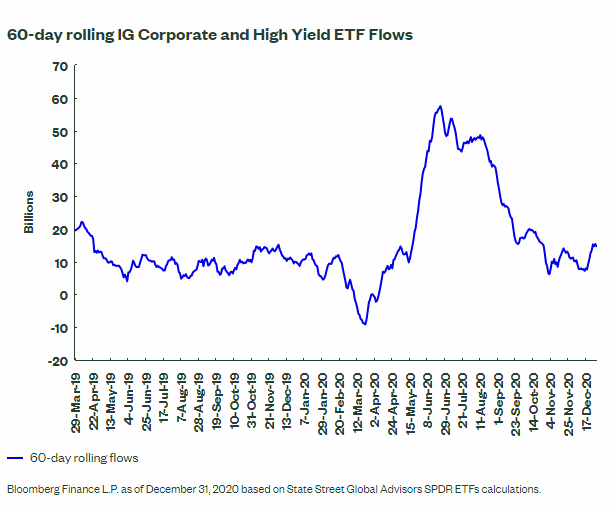
These strong flows were one of the reasons why both segments posted record annual flows in 2020 ($59 billion and $21 billion, respectively) as investors used ETFs to efficiently execute broad macro asset allocation changes. In our view, the Fed itself turning to ETFs as way to efficiently and quickly allocate capital into the credit markets across a broad set of issuers (i.e., avoid single-issuer risk or presence of favorable treatment) in a transparent manner underscores this notion.
The Fed, however, accounted for just 7% of fixed income inflows during its purchasing period,[12] illustrating that more than just the central bank turned to bond ETFs in 2020. More significantly, investors used bond ETFs for an array of portfolio and trading decisions that are likely to continue as adoption increases, some of which include:
- Transfer of assets: Using the ETF as a transition vehicle between managers while overall asset allocation is being reassessed
- Portfolio hedging: Shorting the ETF to reduce credit beta of an overall portfolio while not having to liquidate underlying holdings
- Cash equitization: Maintaining market exposure by transitioning a piece of the underlying portfolio into an ETF covering the same sector that can be readily sold on an exchange with a T+2 settlement to meet client redemptions
- Tactical positioning: Rotating into new exposures based on market dynamics
- Strategic vehicle shifts: Using the market dispersion to swap exposure vehicles from mutual funds to the lower cost, more tax-efficient ETF wrapper[13]
The Liquidity Road Ahead
Diversification, low cost, and transparency are commonly cited as ETF benefits that are expected to drive growth over the next decade. However, the events of 2020 suggest that growth will also be fueled by investors who are making even greater use of ETFs as effective tools for liquidity, price discovery, and market access.
Bottom line, the additive liquidity benefits that ETFs provided in 2020 should build confidence in the structure and lead to more investors making greater use of ETFs to pursue a wider variety of objectives.
Originally published by State Street, 2/3/21
1 Based on 10-day trading volumes and 10-day average CBOE VIX Index levels from January 2010 to December 2019 based on Bloomberg Finance L.P., as of December 31, 2020.
2 Bloomberg Finance L.P. as of December 31, 2020.
3 Bloomberg Finance L.P. as of December 31, 2020 for trading days in 2020.
4 Bloomberg Finance L.P. as of December 31, 2020 based on State Street Global Advisors SPDR ETFs calculation. The Financial Crisis had a streak of 118 consecutive days.
5 Bloomberg Finance L.P. as of December 31, 2020 based on State Street Global Advisors SPDR ETFs calculations. Gross primary market activity is the summation of the gross flows, the absolute value of creations and redemptions, into each fund every day in 2020.
6 Bloomberg Finance L.P. as of December 31, 2020 based on State Street Global Advisors SPDR ETFs calculations.
7 Bloomberg Finance L.P. as of December 31, 2020 based on State Street Global Advisors SPDR ETFs calculations.
8 Based on the sum product of each individual ETF’s highest level of short interest multiplied by the price of the ETF for every year since 2014, per Bloomberg Finance L.P. as of December 31, 2020 per calculations by State Street Global Advisors SPDR ETFs.
9 Bloomberg Finance L.P. as of December 31, 2020 based on State Street Global Advisors SPDR ETFs calculations.
10 Bloomberg Finance L.P. as of December 31, 2020 based on State Street Global Advisors SPDR ETFs calculations.
11 Bloomberg Finance L.P. as of December 31, 2020.
12 State Street Global Advisors SPDR ETFs, based on the Federal Reserve’s reported trades, after applying the daily ratio of secondary to primary market activity to those trades to calculate the potential volume that resulted in an inflow or outflow on a specific day based on Federal Reserve and Bloomberg Finance L.P. as of December 31, 2020.
13 Average bond mutual fund fees are 67 basis points versus 35 for ETFs. Roughly 40% of bond mutual funds paid capital gains in 2020 versus less than 20% of bond ETFs in 2020 per Morningstar as of December 31, 2020.