
When it comes to rotating out of growth-fueled investments and into value-tilted assets, investors shouldn’t forget about small-cap equities. While they might tend to lean towards the growth side of the equation, investors can still get value exposure in small-caps with ETFs like the iShares S&P Small-Cap 600 Value ETF (IJS).
IJS seeks to track the investment results of the S&P SmallCap 600 Value IndexTM, which measures the performance of the small-capitalization value sector of the U.S. equity market. The fund generally invests at least 90% of its assets in securities of the underlying index and in depositary receipts representing securities of the underlying index.
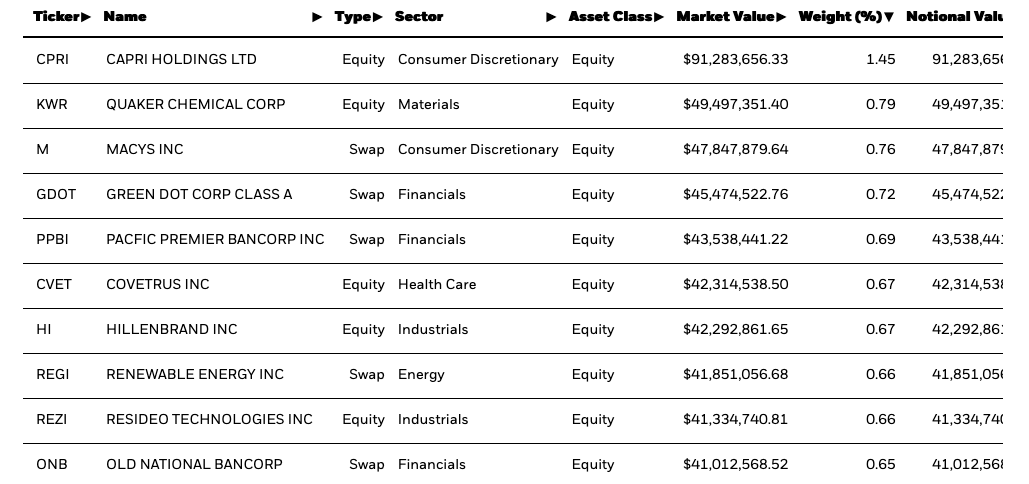
It may invest the remainder of its assets in certain futures, options and swap contracts, cash and cash equivalents, as well as in securities not included in the underlying index, but which the advisor believes will help the fund track the underlying index.
IJS features:
- Exposure to U.S. small-cap stocks that are thought to be undervalued by the market relative to similar firms
- Low cost and tax efficiency
- Use as a complement to a portfolio’s core holdings
The expense ratio of IJS comes in at just 0.18%.

20+ Years of Outperformance for Small-Caps
Just before the pandemic, the markets were already in the throes of a decade-long bull run. It’s a streak that’s been highlighted by large-cap strength as indicated by the major indexes.
“There is no denying that the large-cap S&P 500 Index has outperformed the S&P Small Cap 600 Index and the S&P 400 Mid Cap Index in recent years,” a MarketWatch article said. “The S&P indexes are weighted by market capitalization. That means the hottest companies included in the small-cap and mid-cap indexes will be moved into the indexes with higher market values, while there is no upper limit on the S&P 500. So the S&P 500 is much more concentrated — its five largest companies make up 22.7% of the S&P 500, while the five largest small-cap companies account for only 3.4% of the S&P Small Cap 600.”
But when you look back further, you can see the value in small-cap exposure. It’s all about playing the long game.
“So in a bull market dominated by companies taking the best advantage of technological innovation, it’s no surprise to see the S&P 500 faring best,” the article added. “This holds true if you look back five, 10 or even 15 years (for which the S&P 500 has returned 292%, compared with 263% for the S&P 600 Small Cap Index, according to FactSet). But it hasn’t always been this way.”
The FactSet Chart below suggests small-cap outperformance over the long haul:
For more news and information, visit the Equity ETF Channel.