
By Gary Gordon, Pacific Park Financial, Inc.
The U.S. economy is appallingly dependent on the “wealth effect.” And the U.S. Federal Reserve knows it.
Just how “easy” is the Fed’s monetary policy? The real Fed Funds Rate (FFR) is at -0.8% right now. The last time the inflation-adjusted FFR was down at -0.8% had been 8-9 months into the Great Recession (10/2008). Before that, the country had been 8-9 months into the 2001 recession (12/2001).
Pushing the cost of capital to insanely cheap places used to be a tool for alleviating recessionary pressure. Today? The central bank of the United States believes in the permanence of cheap credit to maintain elevated levels of stock, bond and real estate prices.
The proof of financialization is in the bread pudding. Never in the history of the U.S. economy has the ratio of household assets to nominal gross domestic product (GDP) reached 4.25.
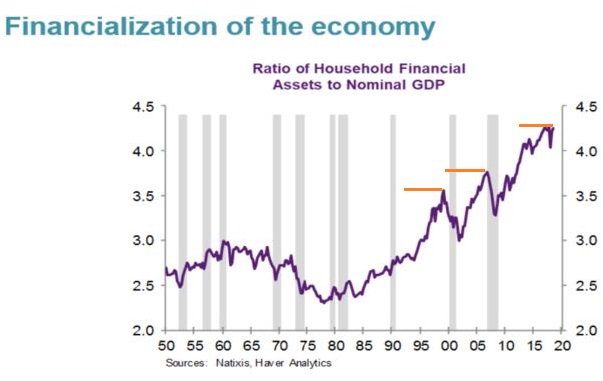
It’s not just the reality that asset price inflation is vital to economic well-being in 2019. Previous wealth effect reversals occurred because of an over-reliance on respective asset bubbles in stocks in 2000 and real estate in 2008. (See the orange lines in the chart above.)
Unfortunately, most of the Federal Reserve committee members only see the “benefits” of the present-day wealth effect. Few of them show any concern about the eventuality of an ugly reversal.
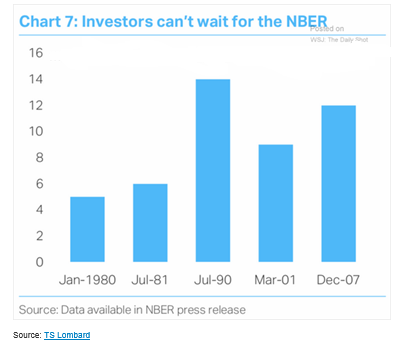
Never mind the probability that the Fed will not have enough ammunition for a crisis or recession. All-star economists are notoriously poor at alerting folks when a recession is happening. In particular, the average number of months between the inception of economic contraction and a pronouncement by the National Bureau of Economic Research (NBER)? 9 months.
Granted, people keep on spending in ways that is keeping the current expansion alive. Indeed, the recent 1.9% GDP print was entirely attributable to the resilience of the consumer.
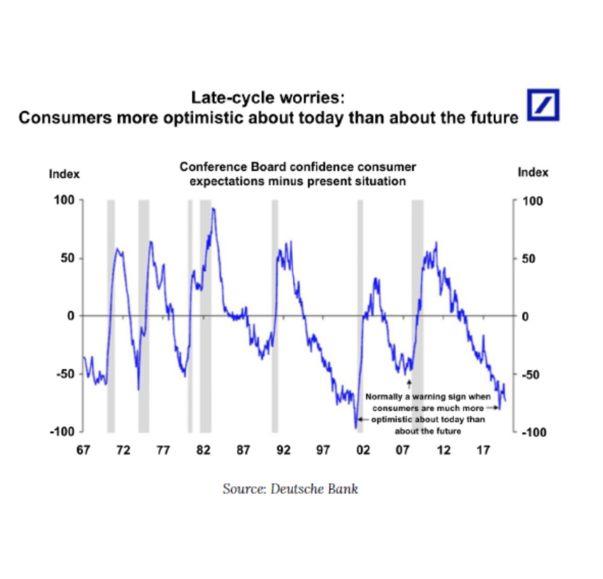
On the flip side, consumers have rarely been as pessimistic about the economic future. The difference between present day circumstances and future expectations are nearly as bleak as they were leading into the 2001 recession. They are even more stark than they were leading into the Great Recession of 2008.
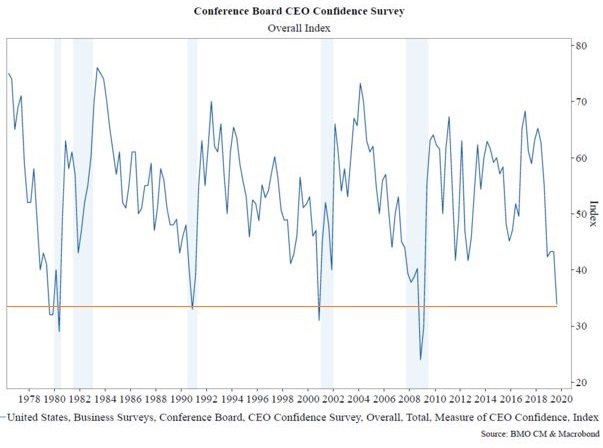
Businesses are already glum. A broad measure of job gains in a survey by the National Association for Business Economics (NABE) is at its lowest level since 2012. Meanwhile, according to Jon Hill at BMO Capital, CEO confidence hasn’t been this low without the economy entering recession or already mired in one.
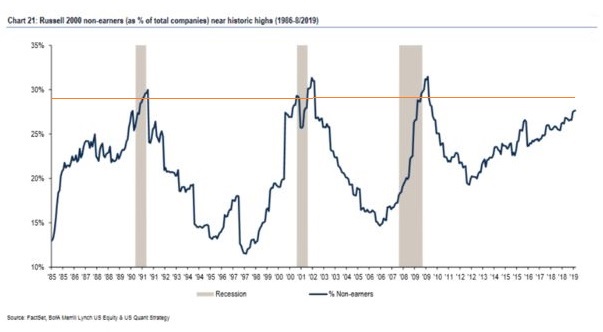
Small companies may be struggling the most. The proportion of non-earners within the Russell 2000 is getting closer and closer to 30%. Jill Carey Hall at Bank of America Merrill Lynch points out that these levels are usually seen during economic downturns.
Of course, none of the troubling specifics imply immediate doom for stocks, corporate bonds, real estate or other risk assets. Chairman of the Fed, Jay Powell, has been keeping the asset price dream alive with three consecutive rate cuts and $60B-plus in monthly treasury bill purchases — a quantitative easing (QE) elixir where the electronic dollar credits eventually find their way into riskier investments.
Think about it. Not only is the FFR stimulus as accommodating as it was during the 2001 recession as well as the Great Recession in 2008, but the Fed’s balance sheet is now back above $4 trillion. (They just keep right on cranking the electronic money printing press!)

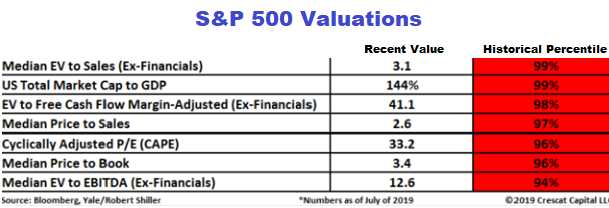
Perhaps ironically, capital spending at corporations continues to weaken and earnings continue to slide. It follows that wildly optimistic earnings estimates for 2020 will need to be slashed, pressuring valuations. And those valuations are already pricey.
Can Fed actions and the actions of other major central banks (e.g., European Central Bank, People’s Bank of China, etc.) really keep U.S. asset prices elevated indefinitely? In spite of late cycle indications? Many in the financial media seem to think so.
However, it is more likely that a shock to the system will trigger a wealth effect reversal. And with it, another recession.
Until that time, though, investors still need to allocate a percentage of their assets to equities. Here are three ways that one may do so, even if the stock bull is close to meeting its maker:
1. Defined Outcome ETFs. Would you willingly cap your upside in the S&P 500 over the next 12 months if it meant you would not experience any losses on the first 15% of a market sell-off? The Innovator S&P 500 Power Buffer ETF (PNOV) seeks to track the return of the S&P 500 Price Return Index up to 8.75% (10/31/19), while buffering investors against the first 15% of losses over the next year (11/1/19-10/31/20).
The cap and the buffer have already changed from PNOV’s inception. At the moment (11/4/2019), with stocks gaining ground on 11/1 and 11/4, the cap is 8% and the buffer is 15.5%. The downside before the buffer would kick in is -0.72%.
2. Trend ETFs. Some folks would prefer to capture all of the market’s upside potential. After all, who knows how “bubblicious” equity indexes will get in the year ahead. Still, is there a mechanism for protecting gains or limiting losses within an equity investment itself?
Enter Pacer’s Trendpilot US Large Cap ETF (PTLC). As long as the market is trending higher, you’re in there. Should a short-term market downtrend develop, PTLC pares back some of its equity exposure. And if the market signals a longer-term downtrend? PTLC shifts its allocation to the safety of treasury bills.
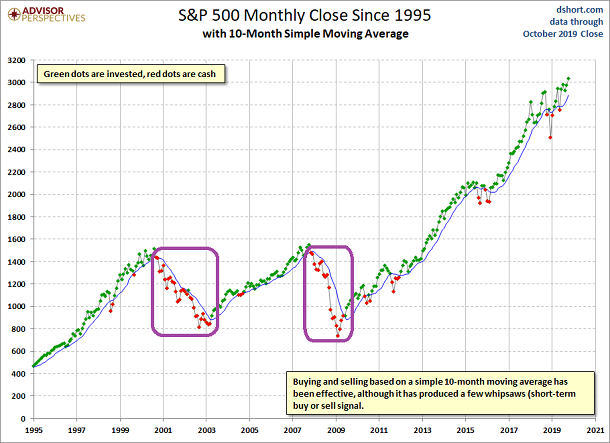
I am a fan of paying attention to technical trends. Long-time readers know that I am particularly fond of the slope of the S&P 500’s 10-month simple moving average (SMA) as well as its monthly close. The monthly close on the 10-month SMA helped me sidestep the bulk of the carnage in 2000 as well as 2008.
3. Value ETFs/Dividend Aristocrat ETFs. It’s not that value stocks and dividend aristocrat stocks represent bona fide bargains; rather, they are relative bargains to the growth stock bonanza that has characterized this decade.
If you’re like me, and you think that the Fed will not be able to override the business cycle altogether, then you might appreciate the SPDR S&P Dividend ETF (SDY) for tracking the total return performance of the S&P High Yield Dividend Aristocrats Index. (The “aristocrats” in this index have a 20-year track record of consecutive dividend increases.)
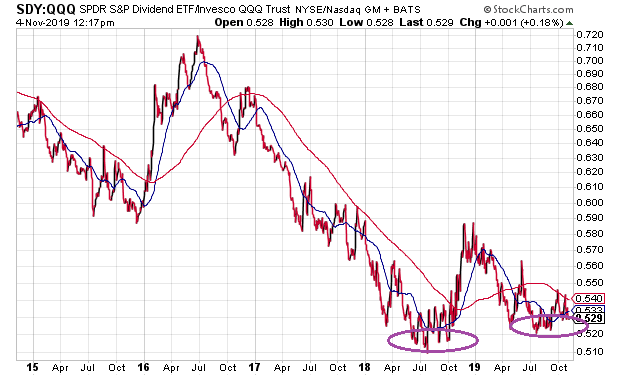
From a technical perspective, the SPDR S&P Dividend ETF (SDY):Nasdaq 100 (QQQ) price ratio is showing a “bottoming process” for SDY. Going forward, SDY is likely to outperform.
Disclosure Statement: ETF Expert is a web log (“blog”) that makes the world of ETFs easier to understand. Gary Gordon, MS, CFP is the president of Pacific Park Financial, Inc., a Registered Investment Adviser with the SEC. Gary Gordon, Pacific Park Financial, Inc., and/or its clients may hold positions in the ETFs, mutual funds, and/or any investment asset mentioned above. The commentary does not constitute individualized investment advice. The opinions offered herein are not personalized recommendations to buy, sell or hold securities. At times, issuers of exchange-traded products compensate Pacific Park Financial, Inc. or its subsidiaries for advertising at the ETF Expert website. ETF Expert content is created independently of any advertising relationship.
This article was republished with permission from Pacific Park Financial, Inc. View the original article here.