I promise I’ll try and keep this one as short as possible.
Everyone knows the SPDR S&P 500 ETF (SPY). On many days, it’s literally the most liquid security in the world. Over the last five days, it’s averaged almost $85 billion in trading. And we’re all just used to it trading “perfectly,” a penny wide, right on fair value, all day, every day.
But with the kinds of market stresses we’ve seen recently, virtually every security that is generally used in Delta-one arbitrage (that is, trading the gaps between two securities that provide theoretically identical exposures, like a basket of 500 S&P stocks, and an ETF that holds the same), is getting tested, and we’re finding out, more and more, that liquidity has a price.
So let’s look at the bananas trading in SPY going into the close on Friday. In case you missed it: the President started speaking at 3:36 or so in the afternoon, on a Friday, when nobody wanted to wear any risk, ever again. The market had been up a little on the day before he started but remember, on the 12th, the market had gone down 9.5% (who can forget). But it was still trading pretty wildly, and we were off the highs of the day. At 3:30, trading desks, portfolio managers, and risk managers were trying to figure out what they wanted to, or had to, have on their books going into the end of the day.
As Trump spoke, the market ramped. All of a sudden, the best-laid plans of these institutions got thrown out the window, as it started to seem like this was a “good news is good news” speech and more importantly, a hand-off to the capitalist infrastructure (which should be suitable for markets, in theory)
And then we get to the close, in the middle of a historic crisis, a historically volatile 30 minutes, and, to top it all off, a Friday.
The Closing Auction
Most investors don’t know, and shouldn’t care, what happens in the last 10 minutes of the market. Honestly, individual investors should just be banned from trading the close, because it’s so fraught with peril. But what happens is those big players put in indications of what they want to do at the close all day long, and have until 3:50 to change their orders for the close, either being price makers (with limit orders helping set the closing price) or just taking whatever the close might actually be. Imagine the scramble to set those, while the White House press conference is still rambling along.
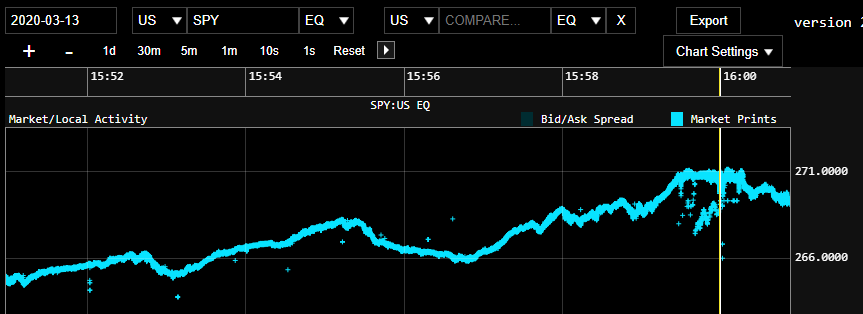
But then 3:50 happens, and at that point, all that’s left is 10 minutes of real orders. Here’s trading looked like in those 10 minutes.

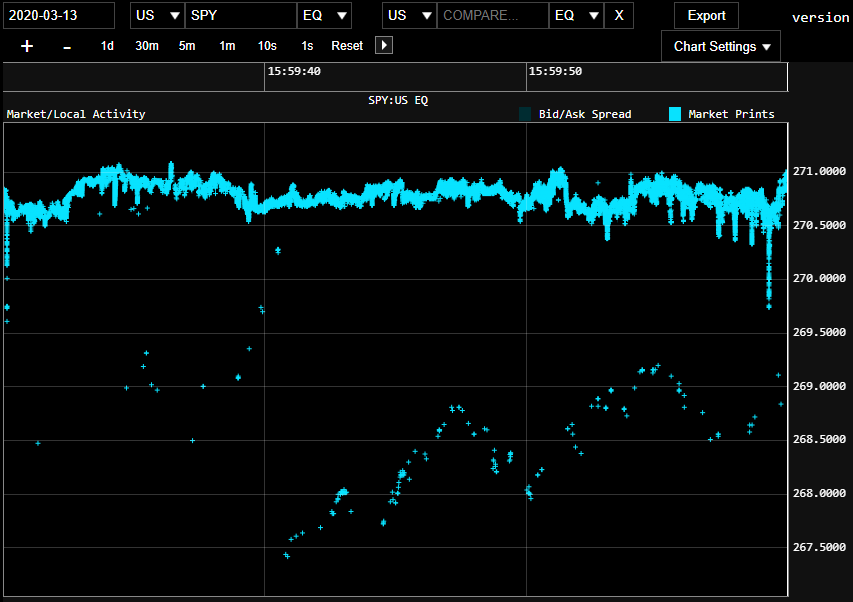
Even just looking, it’s clear things get even wackier as we get down to the final 30 seconds, so let’s zoom into that crazy:
 So what’s happening with all these way below market trades? Every one of them is coming in from the FINRA trade reporting facility. That’s where “off-exchange” trades generally get reported. Those are the results of all sorts of over the counter-type negotiated trades: VWAP trades, big fat risk trades nobody wants, negotiated tail-ends of basket trades in dark pools, etc. Those prices are below the live market because (I’m assuming) they include actual trading activity and order flow from earlier in the day (like VWAP trades).
It’s interesting (to me, at least) to note that at this point in the market, the close is actually over, we just don’t know it yet. Sure, there are feeds from NYSE with the imbalances, but they don’t give you perfect certainty in those last few seconds. The closing price will be created based on the NYSE’s mechanical determination of the price at which the largest volume of closing-trades entered can clear. Trades that were entered at least 10 minutes earlier, but in many cases much, much earlier in the day. So while all those “low” trades look wrong, they’re totally logical.
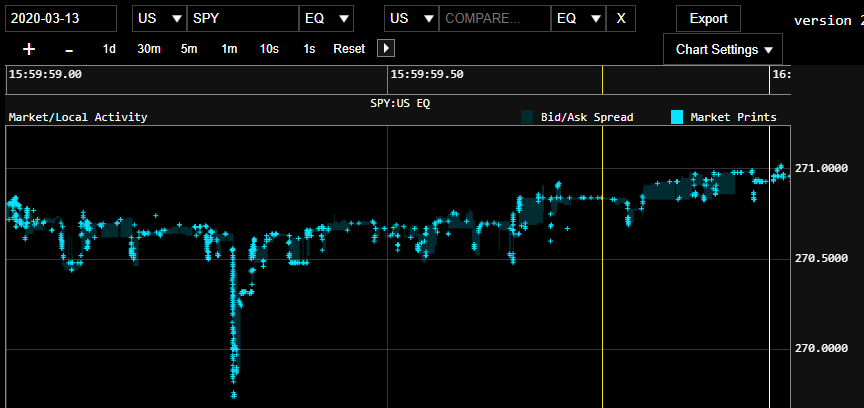
Let’s go one step further down the rabbit hole and look at the last second of trading.

Two things to note here. First, at the very end, its entirely reasonable to look and say, “well, I guess 271 is the closing price.” And you’d be wrong. The closing price of SPY on Friday was 269.32. The actual NAV of the fund (based on the closing auctions of each of the securities in the fund), was 271.49. That means SPY traded to almost a 1% discount!
Now, in most ETFs, that wouldn’t merit a headline. But it’s an enormous, era-defining outlier when it comes to SPY. SPY generally closes the day within a tenth of a basis point of NAV. Does that make the NAV “wrong?” Or does it make the closing price of SPY “wrong?” Honestly, it’s the wrong question. 269.32 is the price of 3/4 of a billion dollars liquidity at the actual close. 271.49 is the price you could have gotten if you had participated perfectly in the closing auction of every stock in the S&P 500. The discount is the value of that much liquidity at that precise moment in time.
Bob Ross This Ain’t
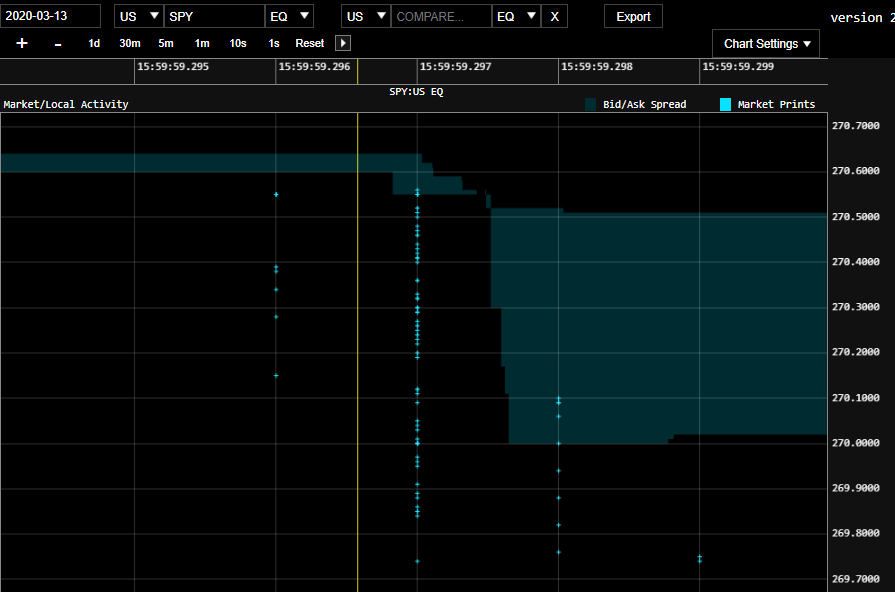
And speaking of precise moments in time, what the heck is that vertical line of trades?
 Welcome the quantum physics of trade analysis, millisecond tapes. Going into 15:59:59:297 (type that three times fast), the spread on SPY was less than a penny. Then hundreds of trades and quotes flooded the market ever so briefly. The result was spreads ballooning out to a whole 5 cents (a grand canyon spread for SPY). This burst of trades had the effect of also dropping the price on SPY for a few milliseconds before it eventually recovered, about 50 milliseconds later.
While it’s impossible to know, with certainty, who is doing what and why when it comes to algos, even a novice eye can look at this and see a classic case of someone or someones trying to “paint the tape” — trying to make it look like “the market” is trading down into the close. Since this is algos, we don’t know precisely what triggers this particular attempt at shenanigans (perhaps an estimate of the closing price from the imbalance indicators), but it didn’t work, and then the market traded back up a bit.
And you? What should you do about this?
For the love of all that’s holy, never, ever trade into the close. Just don’t do it. Lunch. Lunch is a great time to trade.
(All charts source; Trillium Surveyor)
For more market trends, visit ETF Trends.

