The highest Sharpe ratio exists at an allocation of 69% SPY, 31% BTAL. That combination would have delivered an average annual return of about 9.6% at a standard deviation of returns of 5.6% yielding a Sharpe ratio of 1.66. The efficient frontier for this two-ETF combination is below.
Source: Portfolio Visualizer
Looking for the combination that delivers the lowest overall risk? That would be 54% SPY, 46% BTAL. That offers a still respectable Sharpe ratio of 1.44, although average annual returns would have dropped by around 2% annually.
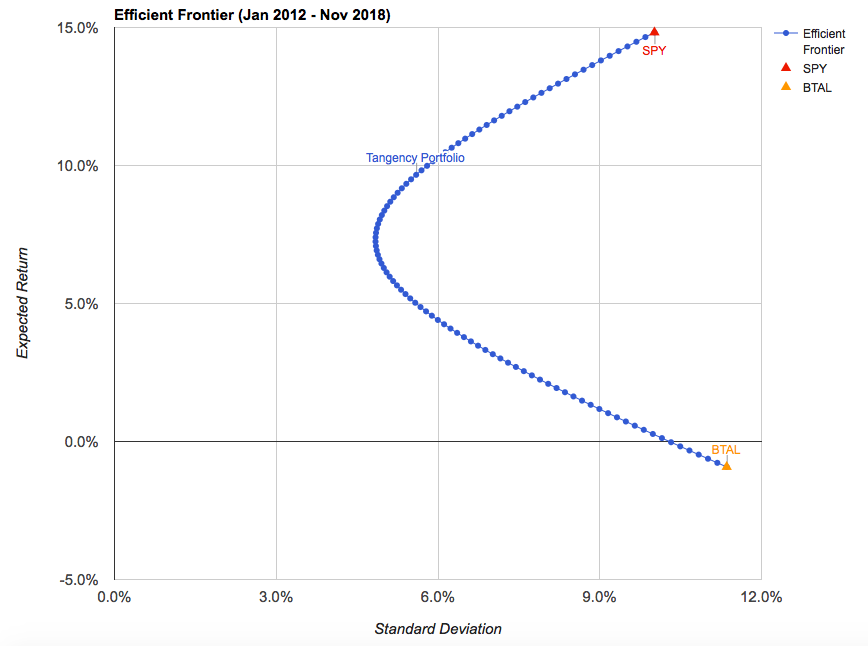
But that example looks strictly at a combination of BTAL and the S&P 500. What happens if we add other asset classes to the mix? This time, I reran the simulation using BTAL, SPY, the SPDR S&P MidCap 400 ETF (MDY), the SPDR S&P SmallCap 600 ETF (SLY), the iShares MSCI EAFE ETF (EFA) and the iShares MSCI Emerging Markets ETF (EEM).
The results are surprisingly similar.
Source: Portfolio Visualizer
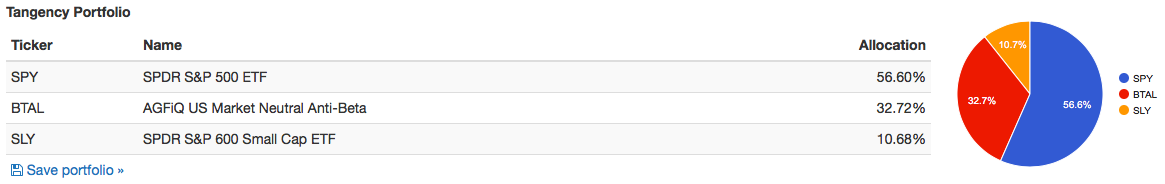
The ideal portfolio would still consist of about one-third BTAL, although 10% of assets would shift from SPY over to SLY.

Source: Portfolio Visualizer
This portfolio is only slightly more efficient than using just BTAL and SPY. The Sharpe ratio rises narrowly from 1.66 to 1.68. The lowest risk portfolio using these components consists of roughly 9% SPY, 50% BTAL, 10% MDY, 17% SLY and 14% EFA and offered an average annual return of just under 6%.
Conclusion
The caveat with all of these backward-looking simulations is that they’re only looking at about 7 years’ worth of data. Ideally, we’d be able to backtest these portfolios going back about 20 years to include the dot-com bubble and the financial crisis, but we get what we get.
If you’re looking to mitigate portfolio risk going forward, should you use a 30% allocation to BTAL as your benchmark? Hard to say without the benefit of additional data, but these results do suggest that BTAL does deserve at least some consideration.
I know that max drawdowns usually come up in these discussions. In the two examples above (Portfolio 1 is SPY, BTAL while Portfolio 2 is SPY, BTAL, SLY), max drawdown is less than half of what you would find investing in just the S&P 500 (note: Sharpe ratios may be slightly different due to rounding in portfolio allocations).
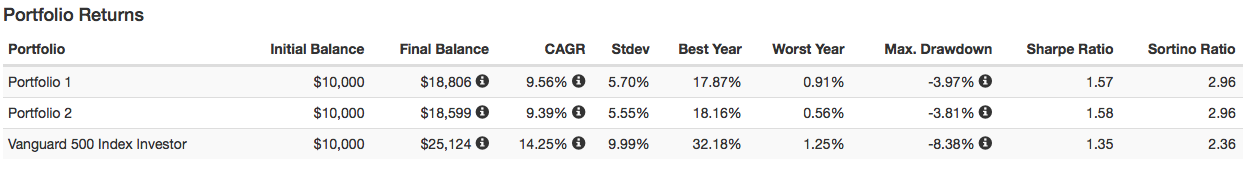
Sharpe and Sortino ratios are noticeably higher in BTAL-hedged portfolios, although that comes at the expense of absolute returns. As far as hedging tools go, I find BTAL to be one of the better, more smartly constructed options out there. Fees tend to be a concern with long/short portfolios and BTAL is no different. However, BTAL recently dropped its expense ratio down to 0.76% putting it in the cheaper half of the alternative ETF group. Assets are under $30 million, so spreads can be a concern when trading BTAL.
Still, I find BTAL to be a nice option for investors whether you’re looking to hedge some volatility in your portfolio or even generate some positive returns.