
The bond market is convulsing in paroxysms of uncertainty. You don’t need me to tell you that. We’re seeing unprecedented moves in every corner of fixed income as markets try and deal with the quintuple threat of a global health crisis, a global recession, an energy price war, an election cycle, and increasing geopolitical tensions. I’d be shocked if something didn’t break.
So it’s easy to see why we’re getting hyperbolic headlines about Bond ETFs “failing the stress test.” I honestly couldn’t disagree more. But two things are failing:
- The bond markets themselves.
- Net-asset Values
The Bond Market
As most folks know, the bond market isn’t like the equity market. Bonds are a dealer market or an OTC market, or at a minimum, a fractured market, depending on your perspective. There is no central limit order book where everyone on the street who owns bonds lists all their prospective buy orders in real-time, with market makers putting capital to work to ensure liquidity.
It used to be a bit more like that. There used to be a market where big banks ran bond dealing desks and acted as the de facto market makers. Did you want something? You called a dealer. Did you need something? You called a dealer. Now, you have to hunt for pockets of liquidity, chasing down Bloomberg messages or leveraging one of several electronic trading venues, hunting for a specific trade. It’s the antithesis of high-speed trading.
This isn’t news. People have been writing about the evaporation of bond market liquidity since before the global financial crisis. Goldman sounded the alarm bells hard in 2015. Deutsche publishes it as a regular part of their chart books: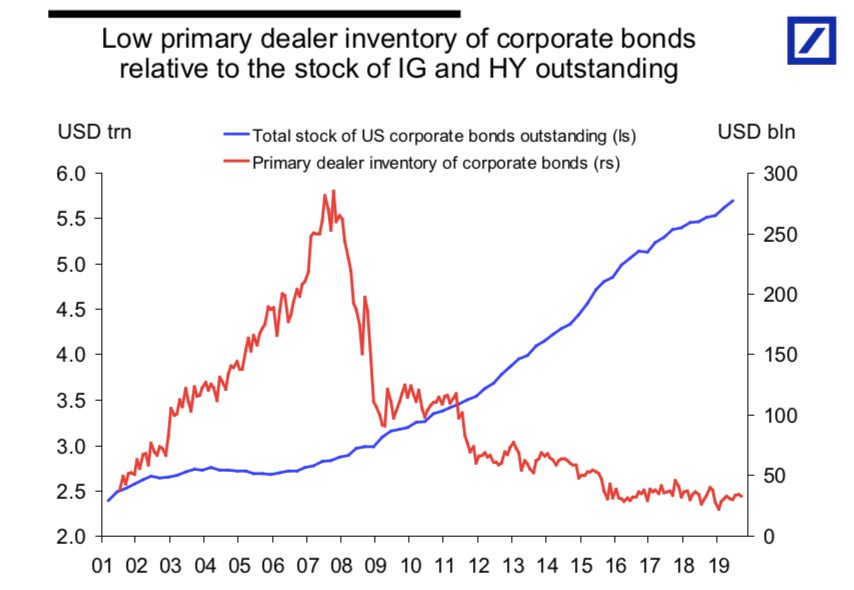
In short, the investment-grade bond market is looking a lot more like the market for fine wine than it is any financial instrument: big splashy auctions where the goods are sold regularly, and then they get locked up in the basement while they age to maturity. You want a bottle of 2015 Chateau d’Yquem or some JP Morgan commercial paper they floated four years ago? You’re going hunting for a seller.
Into that market, we have two primary pooled vehicles investors use to access this market: mutual funds and ETFs.
The NAV Process (and Problem)
Most people have a pretty clear understanding of Net Asset Value: You, the fund accountant, add up all the stuff you own, you subtract any liabilities for the day (like the management fee), your account for any receivables you might be due (like a dividend). That tells you the value of the whole portfolio. Divide by the number of shares outstanding, and voila, you get a per-share value.
If all you own is S&P 500 stocks, this process is usually pretty painless, because there’s a universally agreed on “closing price” for any exchange traded equity. If the stock is big, it gets a closing auction. If it’s not, there are rules the exchanges use to set a closing price based on logical rules (last trades, bid-ask midpoints, and so on).
But what happens if the thing in your portfolio hasn’t traded in a bit? Then it gets tricky. In some cases, you have a choice. If you run, say, a Japanese equity fund, well, at 4 pm your last real price is 13 hours old. In case you hadn’t noticed, a lot happens in 13 hours. So you can use the old prices (and match whatever the index might say, which is probably uses those old closing prices), or you can “fair value” a guess for each security in the fund, based on … stuff. Stuff like “how are the futures” or “is there an ADR that traded” or “is there trading comparable for this company.” You make up numbers for every holding (and let’s be clear, these are fictional prices), and you get your NAV. International ETF and Mutual fund prices are wrong, for just this reason. Either way you do it, you’re wrong. You just try and be “the least wrong.”LQD
Bonds are much, much worse. Here’s a very real-world example from the iShares iBoxx $ Investment Grade Corporate Bond ETF (LQD). It’s been in the headlines lately because it’s been trading at a discount: meaning, the closing price of the ETF has been substantially lower than the Net Asset Value that gets published by iShares at the end of the day. So let’s walk through how those two numbers are created.
Closing Price
LQD has enormous daily liquidity. It has $26 billion in assets. It usually trades over $1 billion a day. On the 17th, it traded $2.2 billion. That’s a lot. It should come as no surprise then that on the 17th, there was plenty of volume going into the close, and then the closing auction.
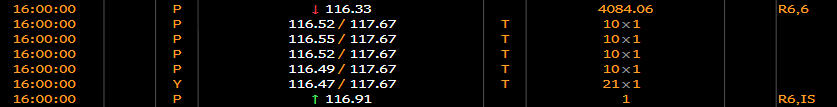 I covered the oddities of the auction process (in SPY no less) just a few days ago so that you can dig in more there, but the only thing to note here is that the closing auction here — the 499,999 shares that crossed at 116.33, is a relatively logical number. Its almost half a percent below the previous trade, but that was for a single share (someone tape-painting), so the 116.33 is a much better bogie — after all, its the price at which $47 million worth of LQD will clear — a price the most sophisticated buyers and sellers in the market agree to trade, right at the close of the day. It’s the price of “a big bunch o trading.” The liquid price.
This is super important: this is the market. This is where buyers and sellers are meeting to decide at what price they will risk capital. They know every one of the 1,984 bonds the fund holds. They have access to the trading data on every single one of those bonds. And $47 million worth of investors put their money on the line for that piece.
NAV
So what’s the NAV of LQD on 3/17? Well, according to Blackrock, (or rather, Blackrock’s fund accountants who are probably their custodian, who is technically hired by the fund board, etc. etc.) – the NAV was 119.03.
“Aha!” says the punditry, “ETFs are broken! See! It traded at a huge discount!!!”
Twaddle.
The NAV is utterly disconnected from reality.
The first problem with bond NAVs is the fair-value problem we established earlier. We KNOW the bonds in LQD will not be trading at 4 pm sharp, and even if they were, there’s no equivalent to a closing auction to get much money to fix the price. So you need to make SOME sort of an estimate if you’re going to say “this fund is worth X.” That estimate is for each individual bond, however long ago it last traded.
If you’re an index fund, you’re in luck: you already get a price for every bond at the end of the day from the index provider! That’s part of their job; telling you, the licensee, precisely how they calculated the index level every day, and that means showing exactly what price they assigned to every constituent in the index. Problem solved, right?
But how does the index provider (or any competitive bond pricing service) come up with that number? They have a model! (Because everyone has a model). While I don’t know the specifics of how IHS Markit (who owns the iBoxx indexes) calculates their prices, it would be typical for them to do a 3 pm snapshot (meaning, look at all the trading closest to 3 pm, bids and asks, proxies like other ETFs, and so on) and then spend an hour or so grinding out all sorts of adjustments to those last trades to account for time, other securities, changes in risk dynamics, Mercury in retrograde, or whatever else feeds their model.
Let’s get some really, painfully specific examples out of LQDs portfolio on the 17th. Let’s start with one of their most liquid bonds, a CVS bond maturing in 2028 with a 4.3% coupon.
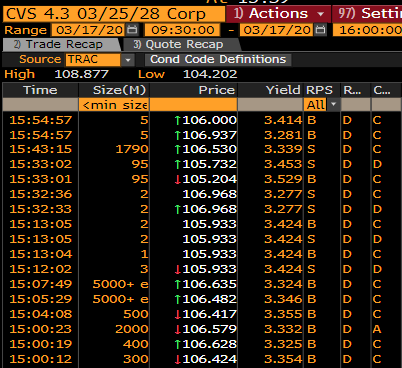
This is it – the pinnacle of investment-grade liquidity. It traded more than a dozen times in the last hour of the market. What’s this bond worth at the close? Is it 106? Because a 5-lot traded there right before 4 pm? Is it 106.53, because that’s the last real liquidity we saw? According to the NAV file, the right price for this bond is 106.07 0– a price incidentally at which the bond never traded at all on the 17th. OK, not perfect, but hardly egregious.
But let’s look a bit further down the holding list, to some bonds which aren’t as widely held as this, but are still among the most liquid 2000 investment grade issues in the market (by definition, since their in LQD). How about an energy bond, like this one from Shell:
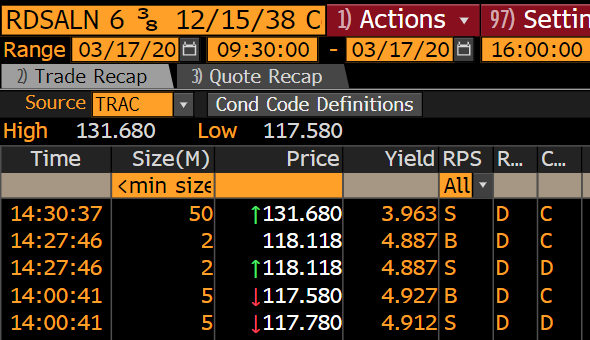
What’s the right closing price for this Gem? Is it 131.68? The price it traded at 2:30? Or is it something closer to 118? According to Markit, the “right” price for this bond 2.5 hours after its last, tiny trade is 128.68, a price that bears no relationship with the reality of this bond.
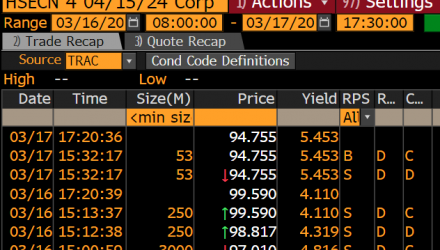
And at the bottom of the list? How about Husky Energy:
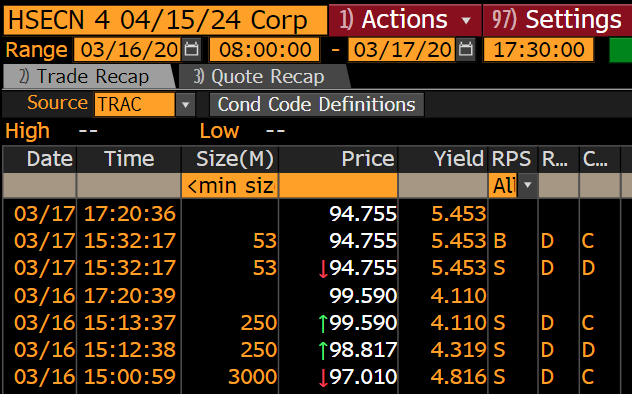
This little gem traded once (its a dupe on the tape) 28 minutes before the close on the 17th at 94.35. But according to the NAV price generated (we assume) by Markit, this bond is supposed to be worth 96.20, about a percent and a half higher.
The Point
So the question is, as an investor, which one of these is “right.” In the very best of times, NAVs on bond funds (mutual and ETF) are manufactured and at best lagging indications. This isn’t a slam on ETF issuers or fund companies or index providers. Index providers have to come up with a price to mark the index. Index fund managers mostly have to use the same values used by the index providers to strike NAV (or they risk huge, fictional tracking error problems).
At the end of the day, there are two prices for a bond portfolio: one which you can calculate from a model which has zero money at work, and, if the portfolio is exchange tradable, a price at which actual money is willing to throw down.
To me, the problem here is clearly with the bond market itself (it’s fractured and illiquid), and with bond NAVs (which are by definition always, with 100% certainty, wrong). Luckily for ETF investors, the NAVs don’t matter much. For mutual fund investors, however, there’s real risk. If everyone starts trying to get out at the seemingly high NAV prices in a traditional mutual fund, the fund manager MUST sell securities. And they’ll sell the most liquid things they can sell. That leaves remaining shareholders with a riskier, less liquid portfolio with every single redemption. This is precisely the toxic cycle that brought down Third Avenue 5 years ago, in a “bond crisis” that now seems positively quaint. If people are looking for the injured class here, it’s not the folks who bought and sold LQD at any time on the 17th – there was a big efficient market setting those prices. No, it’s any mutual investor who put a “buy” order in on a bond fund. They likely overpaid by a substantial amount, and as the NAVs come down to reality (which they do, eventually), they’ll pay the price for their accidental premium over the liquid market.
For more market trends, visit ETF Trends.