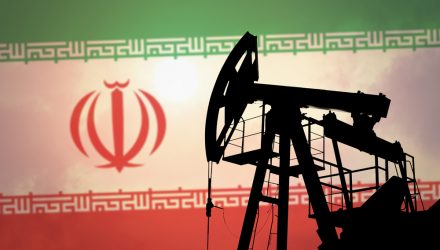
The tailwinds for oil prices keep coming, with a floundering Iran nuclear deal being the latest catalyst to push prices higher, making way for gains in the VanEck Vectors Oil Service ETF (OIH) and the VanEck Vectors Unconventional Oil & Gas ETF (FRAK).
The revival of an Iran nuclear deal struck back in 2015 could have added more supply, putting downward pressure on oil prices. Instead, a delay could keep pushing prices even higher.
“Oil prices rose on Monday as a potential snag emerged in reviving the 2015 Iran nuclear deal that could add more oil supply, while Goldman Sachs said the case for higher prices remains intact even with increased Iran exports,” a Reuters report said.
“However, the speaker of Iran’s parliament said on Sunday a three-month monitoring deal between Iran and the U.N. nuclear watchdog had expired and that its access to images from inside some Iranian nuclear sites would cease,” the report added. “European diplomats said last week that failure to agree an extension of the monitoring deal would plunge wider, indirect talks between Washington and Tehran on reviving the 2015 Iran nuclear deal into crisis. Those talks are due to resume in Vienna this week.”
Former U.S. president Donald Trump walked back U.S. involvement in the deal three years ago and subsequently re-imposed sanctions.
“All in all, it seems to be only a matter of time before the sides involved put pen to paper on a new nuclear accord,” said Stephen Brennock of oil broker PVM. “Investors are bracing for a fresh wave of what will surely be heavily discounted Iranian crude … yet for all this alarmism, an aggressive ramp up in Iranian production and exports is unlikely to stall the drawdown in global oil stocks”
Oil ETFs Keep Pushing Higher
OIH, which is up 35% YTD, seeks to replicate the price and yield performance of the MVIS® US Listed Oil Services 25 Index. The fund normally invests at least 80% of its total assets in securities that comprise the fund’s benchmark index.
The index includes common stocks and depositary receipts of U.S. exchange-listed companies in the oil services segment. Such companies may include small- and medium-capitalization companies and foreign companies that are listed on a U.S. exchange.
FRAK, which is up over 50% YTD, seeks to replicate as closely as possible, before fees and expenses, the price and yield performance of the MVIS Global Unconventional Oil and Gas Index, which is intended to track the overall performance of companies involved in the exploration, development, extraction, and/or production of unconventional oil and natural gas.
For more news and information, visit the Beyond Basic Beta Channel.


