By Adam Schrier, CFA, FRM, Director, Product Management, New York Life Investments
U.S. high yield spreads reached 1087 bps on March 23 after hovering between 350-400 bps for the first six weeks of the year. Faced with a global health crisis and the ensuing economic shutdown, risk assets sold off dramatically – a rapid shift in investor sentiment reminiscent of the financial crisis. From the peak on February 19 through the trough on March 23, a mere 33 days, high yield spreads widened from 357 bps to 1087 bps, and the market declined 21.5%. Spreads have not reached 1000 bps since the financial crisis, and prior to that, it had been since 2002.
Figure 1: Spreads widened and tightened sharply during COVID-19 crisis

Source: Y-charts and ICE indices, as of 06/30/20. Spreads are represented by ICE BofAML U.S. High Yield OAS Spread. Past performance is no guarantee of future results, which will vary. It is not possible to invest directly in an index.
Markets reacted quite favorably to what many have described as an unprecedented Fed response, coupled with a massive fiscal stimulus plan. Following these actions, high yield spreads plummeted, settling in the 700-800 bps range for a month before tightening further to the low 600s by early July.
When compared with investment grade corporate bonds, high yield offered quite a bit more yield. As of June 30, high yield spreads were 484 bps greater than those of investment grade corporates. With 5-year U.S. treasuries yielding less than 0.5% and the 10-year sub 1%, high yield has offered higher income potential for investors that are comfortable moving down the risk spectrum.
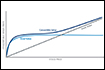
Figure 2: High yield has offered attractive yield spreads compared to investment grade

Source: ICE Data Indices, as of 06/30/20. U.S. High Yield Spreads are represented by ICE BofAML U.S. High Yield OAS Spread; U.S. Investment Grade Corporate Spreads are represented by ICE BofAML U.S. Corporate OAS Spread. Shaded areas indicate U.S. recession. Past performance is no guarantee of future results, which will vary. It is not possible to invest directly in an index.
The opportunity for capital appreciation has been greatest after periods of spread widening when there are signs of recovery. As we have witnessed during the current crisis, this inflection can be extremely quick. In fact, it can be a matter of days – during the current crisis, spreads remained wider than 1000 bps for only four days. Since 2000, spreads have been wider than 1000 bps only 5% of the time (on a month end basis) – and almost all of these periods occurred during the financial crisis.
So while history has shown that risk taking during these times has been rewarded, these times are often filled with uncertainty, change, and sometimes crisis. Consequently, timing the market is extremely difficult and we do not advocate doing so. By mis-timing the market, an investor may capture the market decline, but miss out on the subsequent recovery.
We believe that by keeping a long term view and maintaining a strategic allocation to high yield bonds, investors can benefit from income, capital appreciation potential, and diversification. Further, investors may also benefit by selecting a skilled manager that can take advantage of short-term noise and dislocations. Still, the question remains – as spreads approach historical averages, what happens now?
The charts below depict median returns of high yield and core bonds since 2000 given corresponding spread ranges. For context, the median spread over the time period is 502 bps. Whether spreads fell below 700 bps or 600 bps, high yield has historically outperformed core bonds. Therefore, despite spreads approaching long-term averages, high yield may still provide investors with favorable investment outcomes. Again, having a long-term view is advantageous – spreads at or modestly wider than 502 bps have produced a median excess return of almost 1500 bps over 3 years, with respect to core bonds. Investing when spreads were 100-200 bps wider than the median has produced 2000 bps of cumulative outperformance on a historical basis.
Figure 3: High yield has outperformed core bonds as spreads approach historical averages

Source: Morningstar and Ice Data Indices; 20-year period 06/30/00-6/30/20. High yield is represented by ICE BofAML U.S. High Yield Index; Core bonds are represented by Bloomberg Barclays U.S. Aggregate Index. Past performance is no guarantee of future results, which will vary. It is not possible to invest directly in an index.
Since the Fed announcement, returns across a number of risk assets have been impressive, high yield included. Given the velocity at which spread momentum moves during inflections, timing spread peaks and troughs is difficult and small mis-steps may lead to inferior performance versus a long-term approach. The capital appreciation seen during the second quarter has certainly been impressive, however we still believe opportunities remain for long-term investors to generate attractive levels of income and total returns. As uncertainty is still prevalent in the market and in the world, it is important to choose a manager with a disciplined credit process– one that can uncover opportunities, while also avoiding risk when not being appropriately compensated for risk-taking. When investing in high yield, the how is more important to consider than the when.
About Risk
Past performance is no guarantee of future results, which will vary. All investments are subject to market risk and will fluctuate in value.
Funds that invest in bonds are subject to interest-rate risk and can lose principal value when interest rates rise. Bonds are also subject to credit risk, in which the bond issuer may fail to pay interest and principal in a timely manner, or that negative perception of the issuer’s ability to make such payments may cause the price of that bond to decline. Investing in below investment grade securities may carry a greater risk of nonpayment of interest or principal than higher-rated bonds.
This material represents an assessment of the market environment as at a specific date; is subject to change; and is not intended to be a forecast of future events or a guarantee of future results. This information should not be relied upon by the reader as research or investment advice regarding the funds or any issuer or security in particular.
The strategies discussed are strictly for illustrative and educational purposes and are not a recommendation, offer or solicitation to buy or sell any securities or to adopt any investment strategy. There is no guarantee that any strategies discussed will be effective.
This material contains general information only and does not take into account an individual’s financial circumstances. This information should not be relied upon as a primary basis for an investment decision. Rather, an assessment should be made as to whether the information is appropriate in individual circumstances and consideration should be given to talking to a financial advisor before making an investment decision.
Definitions
Bloomberg Barclays U.S. Aggregate Bond Index is a broad-based benchmark that measures the investment-grade, U.S. dollar-denominated, fixed-rate taxable bond market, including Treasuries, government-related and corporate securities, mortgage-backed securities (agency fixed-rate and hybrid adjustable-rate mortgage pass-throughs), asset-backed securities, and commercial mortgage-backed securities.
ICE BofAML U.S. High Yield Index tracks the performance of U.S. dollar-denominated below investment grade corporate debt publicly issued in the U.S. domestic market.
Yield is the income return on an investment, such as the interest or dividends received from holding a particular security.
Option-adjusted spread (OAS) is the measurement of the spread of a fixed income security rate and the risk-free rate of return, which is adjusted to take into account an embedded option.
“New York Life Investments” is both a service mark, and the common trade name, of certain investment advisors affiliated with New York Life Insurance Company. Securities distributed by NYLIFE Distributors LLC, 30 Hudson Street, Jersey City, NJ 07302. NYLIFE Distributors LLC is a Member FINRA/SIPC.