What is the lesson to be learnt? A detailed analysis of the company’s management’s assumptions for their benefit pension plan scheme serves as a good indicator if they are aggressive or conservative in their calculation’s assumptions.
5) Cash and restricted cash (cash available for shareholders).
A lot of multinationals have a large part of their cash and cash equivalents in foreign affiliates outside of their headquarter country making them unavailable for direct distribution among investors. As a result of this, we must adjust this line item for overseas cash repatriation costs at the given tax rate.
- Case study 5: Apple Inc
Apple has a total cash position of USD 250 billion but we cannot assume this full amount when valuing the company without first accounting for the taxes that must be paid when repatriating back to the U.S. In the 2017 annual report (Table 15), we can see how much of this cash is outside the U.S.
![]()
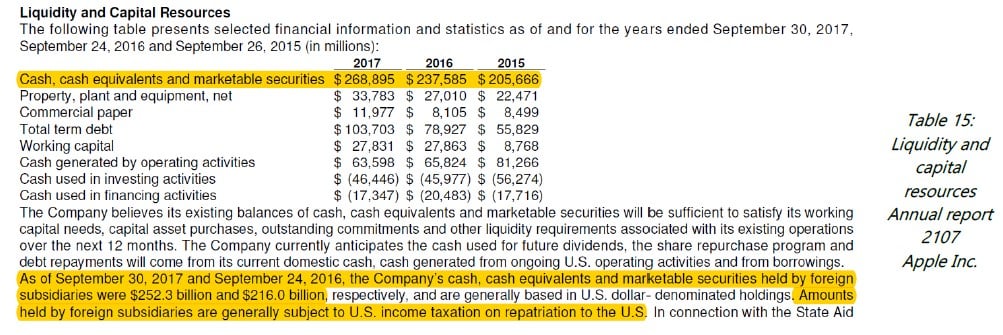
What is the lesson to be learnt? Never assume 100% of total cash and cash equivalents is availability for distribution to shareholders when you are valuing a firm.
6) Contractual obligations detail and future payment liabilities.
Companies disclose future payment liabilities relating to debt, suppliers, creditors, capital and operating leases, provisions, contingent provisions and any other long-term contractual obligation.
Analysts must; therefore, factor in these items to determine all cash outflows a company will have to pay and the minimum required liquidity it needs in order to meet them.
- Case study 6: Tesla Inc.
We are all familiar with Tesla’s all-electric vehicles and clean energy business, but it is important to remember that it remains a highly leveraged company, despite its short-term success. Since we are now towards the low end of the interest rate cycle, Tesla could end up in financial trouble under an economic interest rate upward cycle, which is why it becomes even more relevant to understand cash positions to serve future payments in high indebted companies.
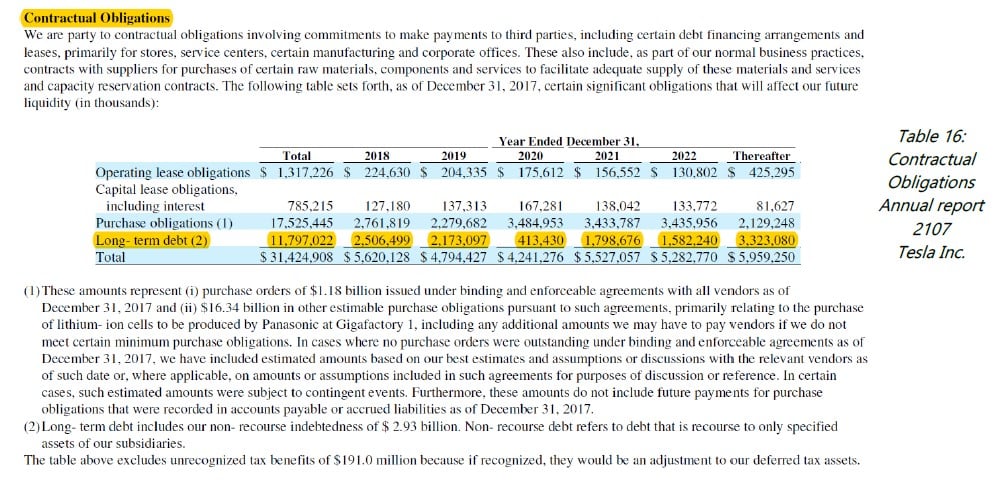
In Table 16, we can clearly see how debt payments make up a vast majority of the company’s future outflows of cash, but we could also expect even more substantial payments to come, if there is a significant change in interest rates leaving Tesla without the possibility to service its debt.
What is the lesson to be learnt? Investigate always for any liability that can increase the leverage and reduce free cash flow.
7) Assigning recurring acquisition costs as Capex.
When valuing companies on Free Cash Flow metric, on occasions, analysts don’t adjust for acquisition capex when these costs are recurring or necessary to sustain the company’s sales growth. We do so by subtracting the average acquisition Capex so that our number is comparable to other companies that are not growing inorganically.
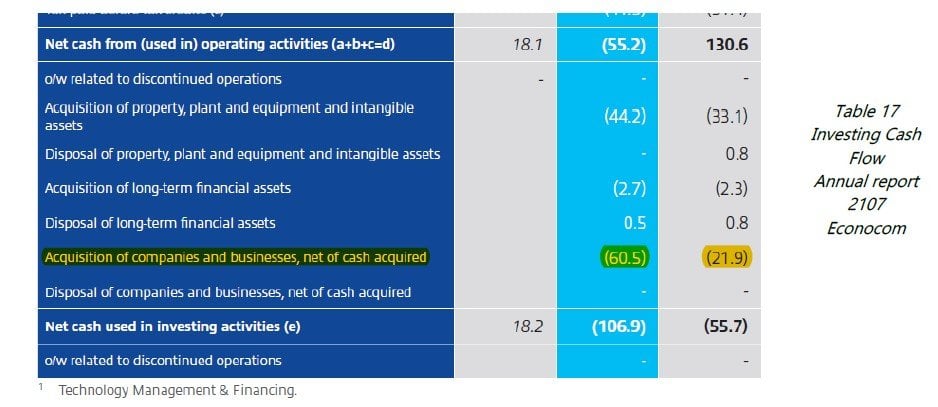
Under Table 17 and 18, we can see the inorganic Capex for 2017 and 2016 but if we go back by about 10 years, Econocom spends on average EUR 35 million or the equivalent of 1% twelvemonth sales in acquiring other businesses. We can then conclude that it is a recurring amount, which we must subtract when calculating our Free Cash Flow.
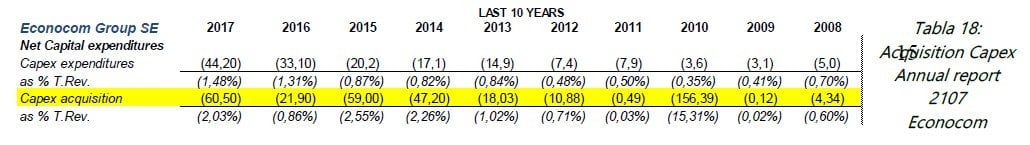
What is the lesson to be learnt? Without adjusting for recurring Capex, we could expose ourselves to an overvalued Free Cash flow for a company that relies on inorganic and recurring acquisitions to deliver year-on-year growth.
8) Auditor opinions.
Investors must ALWAYS review the auditor’s opinion on a company’s financial statements making sure it has the word ‘unqualified’. This guarantees the auditor’s agreement without exceptions on the presentation and content of its financial figures. Other expressions of opinion would need to be reviewed in greater detail.
A ‘qualified’ opinion – or one with exceptions – would mean the auditor partially agrees with the presentations of the financial statements but may have some reserves on certain points. By contrast, an adverse one, indicates disapproval as the numbers fail to accurately reflect the current socio-economic status of the company. Lastly, ‘disclaimer of opinion’ signals an absence of judgement from the auditor, due to lack of information or collaboration from the company under audit.
- Case study 8: Abengoa and Carbures
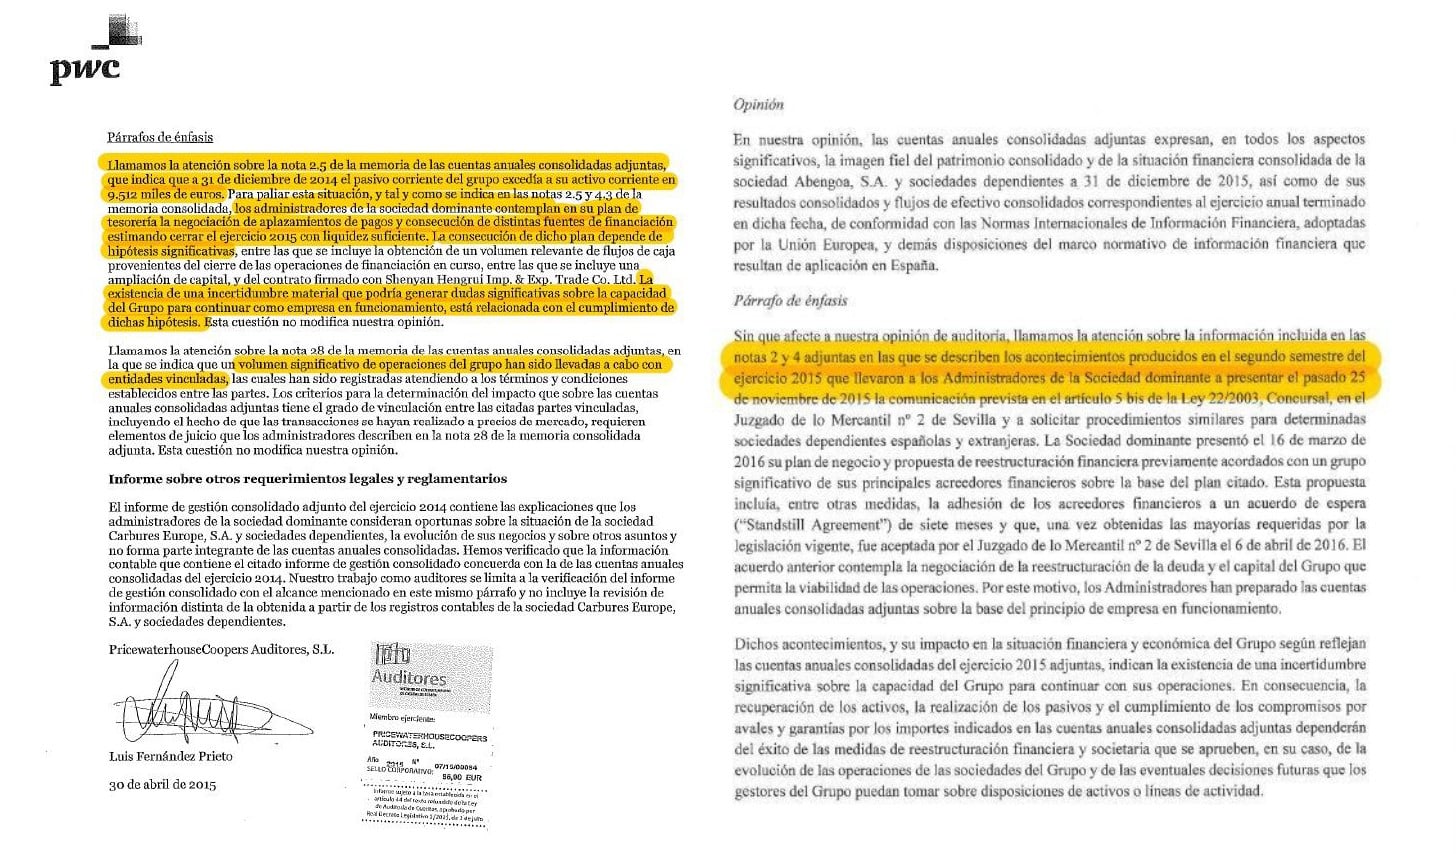
In both cases (Text 6 and 7), the auditor expressed their unfavourable view on the financials due to several reasons, which forces the investor to dive deeper in their analysis and rule them out as possible investments. Fraudulently misstating financial statements not only deceives investors but could also imply auditors in the process.
What is the lesson to be learnt? On most occasions, reading through the auditor’s opinion will helps us identify possible ‘red flags’.
9) The use of derivatives in accounting financial statements.
The use of derivatives is another complex component within a company’s accounting and auditing but in general terms, they need to be identified as either an asset or liability on the balance sheet; at either a market or reasonable value, if market prices were deemed unreliable. Changes in these instruments from one period to the next must be booked as either income or capital and this is perhaps one of the biggest challenges to break down. General accounting guidelines under IFRS and USGAAP differ on how they should be treated which is why it is important to read up on the footnote in the filing to see if the company has had a significant change in their year on year market exposure as well as any other relevant qualitative and quantitative information.
Under USGAAP, derivatives are classed into several types 1) foreign exchange derivative – commonly used to hedge the net asset value of foreign subsidiaries in a foreign currency. 2) Fair Value Hedges are used to offset or compensate the fair value changes of an asset or liability on balance sheet while 3) cash flow hedge is aimed at mitigating variability in a company’s cash flow from a specific risk on balance sheet. Only Fair Value Hedges are recognised as a profit or loss on the income statement. The other 2 derivatives fall under a company’s Equity and are outlined in detail under the statement of retained earnings.
Reading up on derivatives within a company’s accounting will shed light on a company’s perception of balance sheet risk and the type of hedging instrument it uses to mitigate them. We Looking at this section within the filing, we should ask ourselves 1) Which risks are being hedged by the derivatives 2) Is it material the amount of money in derivatives in terms of the balance sheet? 3) What is their maturity? 4) How do they classify on balance sheet? 5) What is the impact of the profit or loss that is yet to be accounted for under equity?
- Case study 9: Medtronic (MDT)
Medtronic develops, manufactures, sales and distributes medical devices to hospitals, doctors and patients around the world. Under text 8, an extract from their filing, we can see how MDT uses foreign exchange forwards to hedge their sales for USD 11.5 billion in April 2018. Their total consolidated sales from abroad is USD 14.078 billion, meaning 82% of them are being hedged.
Under Table 19, we see the market value of the derivative instruments, separating those that don’t qualify as hedging. At the end of April 2018, the market value of the assets is USD 118 million and USD 258 million, for liabilities.
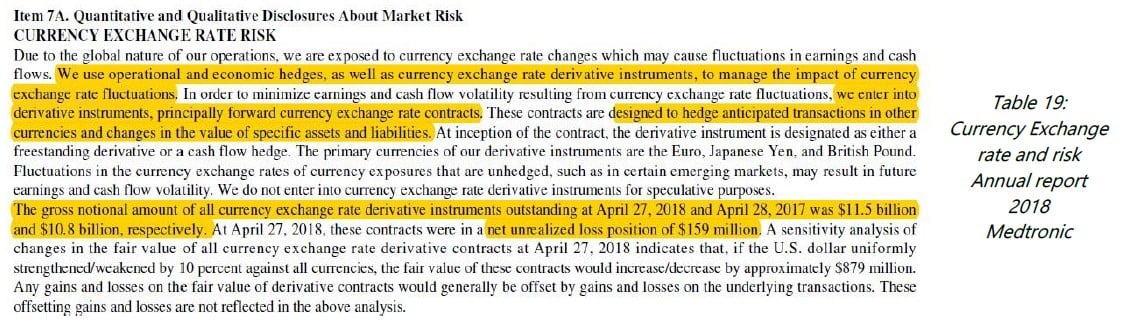
Table 20 shows the impact and the profit or loss from derivate instruments which are broken down to identify which of them are cash flow hedges and which are not. MDT accounts for a loss in equity of USD 404 million at the end of their fiscal period and to the right of the table, we can see how that amount is then reclassified in 2018 under the P&L with a total sum of USD 69 million.
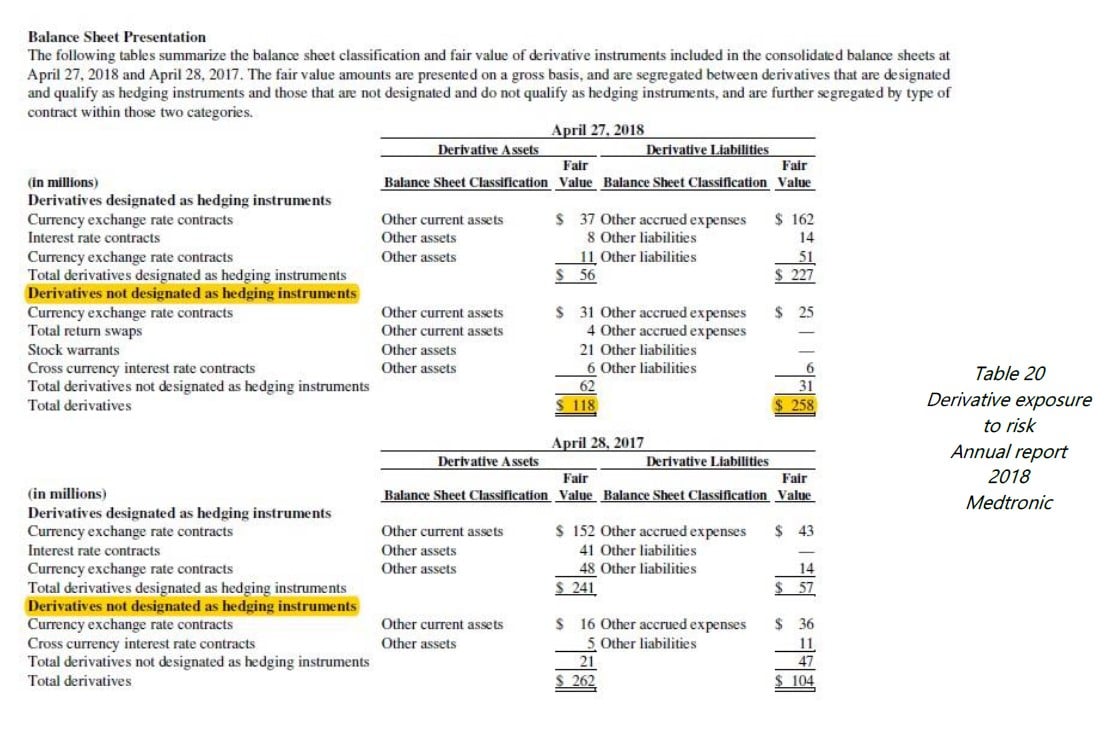
What is the lesson to be learnt? The use of derivative by a company could serve as an indication into the type of risk it’s assuming, as well as their internal policies to hedge sales or effective cash flow management.
PORTFOLIO HOLDINGS.
The top 10 holdings represent more than 53% of assets under management and the top 20 investments, more than 82%. By geographic distribution, 29% is concentrated in Europe, 22.5% in the United States, 21.3% Global, 12.4% Canada while 14.7% is in Emerging Markets. By competitive advantage, 41.2% are due to size or are serving niche markets, 28.7% owe it to switching costs, 22.2% intangibles while 7.9% are because of a network effect. If we break it down by size, more than 90% are SMid Caps* and, on average, there are 9 broker analysts covering the stocks in our fund. Our 1-year local Beta is 0.56 and the 3-year local Beta is 0.61. The fund’s price to earnings is 13.86x, in other words, a discount of more than 30% versus 19x the market’s price to earnings.
All in all, we have a cheaper fund of higher quality versus that of the market, supported by an average return on invested capital (ROIC) close to 16%.
During the second quarter of the year, we made new investments in 2 companies that may not strictly fall into our fund’s preference towards smaller cap companies; however, we will not turn a blind eye to larger market cap companies if the market has them on offer and we consider a ‘bargain’.
Vetoquinol, S.A. (VETO) is a French business with EUR 628 million market cap, specialized in manufacturing veterinary pharmaceuticals for pets and livestock. The family owns 62.5% of shares and the employees, 4.6%; largely unchanged percentages since 2010.
Despite it being the 7th largest player by worldwide market share, the veterinary pharmaceuticals industry is surprisingly concentrated among the top 4 players, making up 52% of the world’s market share while the next 5 competitors only have 15%. On 31st May, we spoke to VETO’s senior management to understand their product positioning and how they competed. After our exchange, we were told how VETO competes in niche markets selling medication for treating mastitis, bacterial respiratory and reproductive diseases in livestock and osteoarthritis, dermatitis and parasitic treatments for pets.
VETO’s average return on invested capital in the last few years has been approximately 13% with a strong trend, in our opinion, to continue maintaining that rate. Their average purchase share price was EUR 50.5 which can also be read as 15.2x price to earnings multiple. For now, we will continue to wait patiently for a market correction that will allow us to increase our share.
Winpak Ltd. (WPK) is a small Canadian manufacturer and distributor of packaging products for the food and pharmaceutical industry, with a network of 10 factories across 10 different countries. It has a predominant presence in the U.S. and Canada. company and has a total market cap of EUR 1.862 million. Its competitive advantage lies in one of its patent-protected flexible packaging products. We like the fact that Its clients are not price sensitive which means WPK is in some ways shielded from economic downturn cycles.
in the last 10 years of business, WPK grew at an average compound growth rate of 6% in sales (organic and inorganically) and double-digit growth in profits. In their latest earnings release call, WPK has changed to a more conservative tone, anticipating short-term challenges. This announcement triggered a sell-off in shares, making it an interesting entry-point to invest. The uncertainty is mainly due to the recent commercial trade war initiated by Donald Trump that increase costs on raw materials, like aluminium and steel. In our view, we see it as a temporary issue, as WPK is flexible enough to source its supplies in other areas without exposure to tariffs.
Return on Invested Capital (ROIC) for the last 10 years has reached almost 20% and we see this as sustainable in the future. The weighted average price per share was USD 44 with a cash price to earnings ratio of 15x.
Lastly, in the second quarter we acquired Inditex and Facebook; both extraordinary companies with a great market capitalisation.
Best,
Quim Abril Auladell.
Founder and Portfolio Manager of Global Quality Edge Fund.
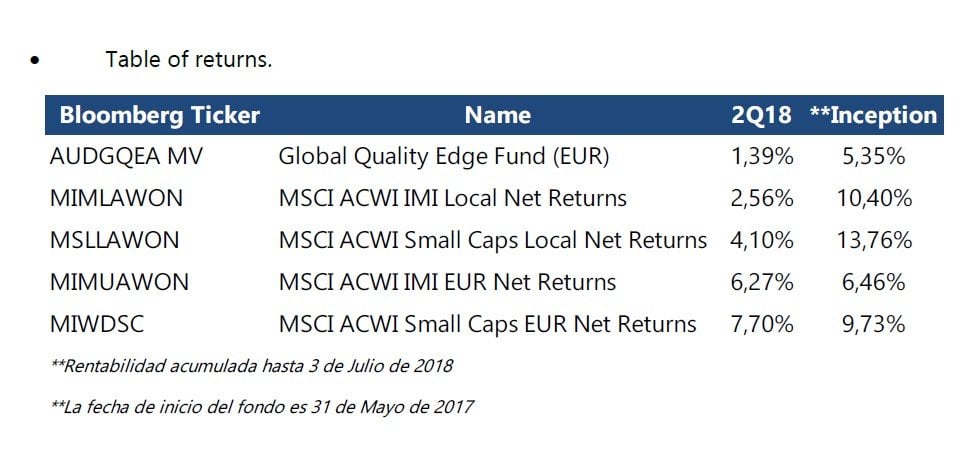
Appendix: Total returns and benchmark indexes.