

SUMMARY
With the start of a new month, I think the equity market is trying to find a balance between “new month demand” (investment and trading dollars put to work at the start of a new month) and some potential near-term buyer fatigue. Within that context, we are watching to see if positive year-end seasonality will prevail as the NDR Catastrophic Stop Loss Model remains on a buy signal.
POSITIVE PRICE TREND AND POSITIVE SEASONAL BIAS OVERWHELM SHORT-TERM OVERBOUGHT CONDITION AND RESISTANCE
In reflecting on the domestic equity market’s tape action last week and my comments at the start of last week that “parts of the market were statistically overbought short term and near resistance,” I came upon the following quote by John Bollinger, from which the title of this report derives:
The most bullish thing the market can do is get overbought and stay so.
This was clear last week when, despite the short-term overbought condition, the S&P 500 (SPX/4605.38) managed to rally more than 1% and hit record intraday highs on four of the week’s five trading days. In fact, the technology-heavy indices and proxies, specifically NASDAQ 100, NASDAQ, NYSE FANG+, and SPX, were up between 1.3% and 3.2% for the week. Additionally, the Consumer Discretionary ETF, which is currently overweighted according to the NDR Sector Allocation Model, was up 4.36% last week thanks in large part to TSLA.
Would I still like to see the equity market “reset”—consolidate or pullback? Yes, especially since trading sentiment is getting frothy—a lot of short-term bullishness. Did a reset occur last week? No, though Friday’s breadth statistics were not supportive of the indices’ price gains, the SPX Equal Weight Index relative strength trend hit a multi-month low, and small and mid-cap proxies were flat to down for the week. Consistent with this and the summary above, let’s identify some underlying support levels—Figures 1 and 2.
Figure 1: A few different pockets of support exist between the following areas: 4551 to 4524 (top green box—bolded because this range is important, short-term), 4496 to 4488 (green circle) and 4465 to 4440 (lower green box).
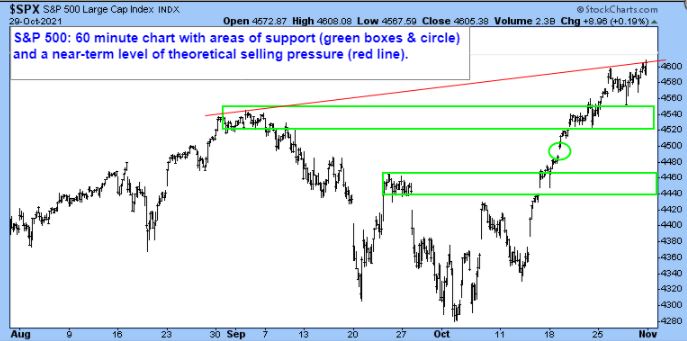
Figure 2: A longer-term daily chart of the SPX, including the same areas of support as shown in Figure 1, plus rising 50-day MA (blue line) and rising 150-day MA (green line).
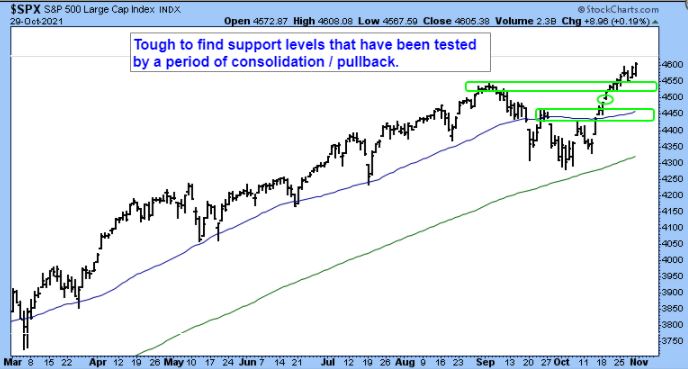
Figure 3: A breakout for Small Caps would be “smiled upon” and could lead to further topside probing, but as Wall Street experienced since early 2021, this is not a necessity for further topside probing by Large Caps.
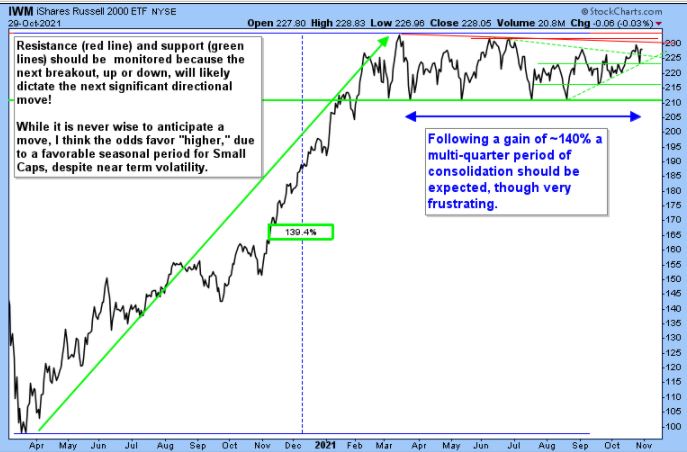
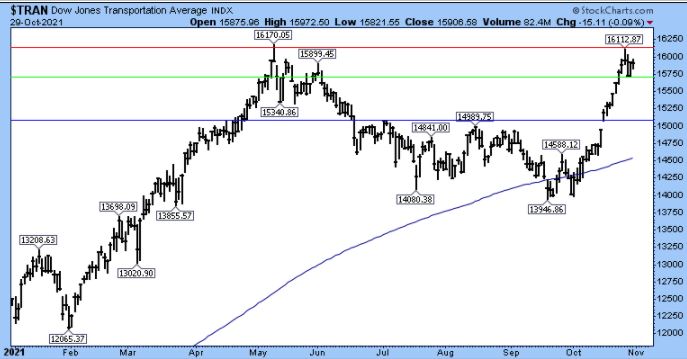
Figure 4: Dow Jones Transportation Average (TRAN/15906.58)—good example of resistance between 16113 and 16170 (red line) and support in and around 15720 (green line).
REACT OR ANTICIPATE
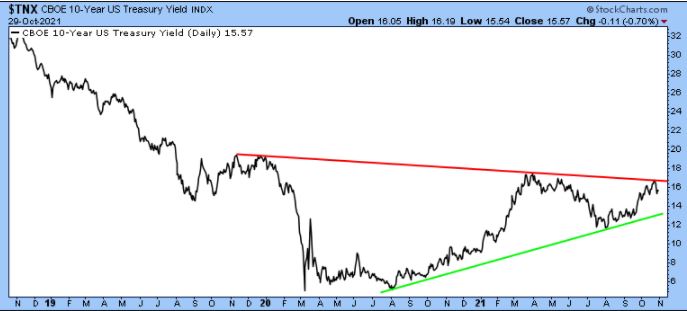
Figure 5: The path of least resistance for the CBOE 10-Year Treasury Yield Index (TNX/15.57 = 1.55%) will likely be dictated by a close above resistance (red line) or below support (green line). I believe a resolution to the “coiled spring” pattern shown below will occur sooner than later. I also believe that in this case, it is more prudent to react after a breakout occurs versus trying to anticipate in which direction a breakout will occur.
Day Hagan Asset Management appreciates being part of your business, either through our research efforts or investment strategies. Please let us know how we can further support you.
Art Huprich, CMT®
Chief Market Technician
Day Hagan Asset Management
—Written 10.31.2021. Chart and table source: Stockcharts.com unless otherwise noted.
UPCOMING EVENTS
• Day Hagan Technical Analysis with Art Huprich, CMT, November 9, 2021, at 4:15 PM ET
• Day Hagan Technical Analysis with Art Huprich, CMT, November 9, 2021, at 4:15 PM ET
• Day Hagan/Ned Davis Research Smart Sector with Catastrophic Stop with Art Day, November 17, 2021, at 1:15 p.m. ET
• Day Hagan/Ned Davis Research Smart Sector with Catastrophic Stop with Art Day, November 17, 2021, at 4:15 p.m. ET
• Day Hagan Market Update with Donald Hagan, CFA, December 8, 2021, at 4:15 PM ET
For more news, information, and strategy, visit the ETF Strategist Channel.
Originally published by Day Hagan Asset Management on November 1, 2021.
Disclosure: The data and analysis contained herein are provided “as is” and without warranty of any kind, either express or implied. Day Hagan Asset Management (DHAM), any of its affiliates or employees, or any third-party data provider, shall not have any liability for any loss sustained by anyone who has relied on the information contained in any Day Hagan Asset Management literature or marketing materials. All opinions expressed herein are subject to change without notice, and you should always obtain current information and perform due diligence before investing. DHAM accounts that DHAM or its affiliated companies manage, or their respective shareholders, directors, officers and/or employees, may have long or short positions in the securities discussed herein and may purchase or sell such securities without notice. The securities mentioned in this document may not be eligible for sale in some states or countries, nor be suitable for all types of investors; their value and income they produce may fluctuate and/or be adversely affected by exchange rates, interest rates or other factors.
Investment advisory services offered through Donald L. Hagan, LLC, a SEC registered investment advisory firm. Accounts held at Raymond James and Associates, Inc. (member NYSE, SIPC) and Charles Schwab & Co., Inc. (member FINRA, SIPC). Day Hagan Asset Management is a dba of Donald L. Hagan, LLC.