

By John Eckstein, CIO
Many of our clients are concerned about a rise in inflation. This note takes a hard look at various supposed inflation hedges. We will look at stocks, bonds, REITs, gold, commodities, T-bills and TIPS: the answer may surprise you.
I don’t see one size fits all answers to this question but in general, I believe our research shows the following:
- Shortening fixed income duration, a great deal can provide benefit
- Equities have had the highest real return, but come with large risks
- I don’t see gold as having much of a useful place as an inflation hedge
- Other commodities may be a useful hedge, but need to be used carefully
The chart below shows inflation as defined by the consumer price index from 1950 to Oct 2021. The eye is drawn to the inflation of the 1970s, wrung out of the system by Fed Chair Paul Volker in the early 80s. Inflation has been tamer since, averaging about 2.4% per year over the last 20 years. While the Fed used to maintain a constitutive ambiguity about how it defined price stability, in 2012 it officially announced a 2% inflation target in 2012, giving investors an explicit anchor for expectations and citizens a benchmark for the central bank.

DATA PROBLEMS
Before we dive into the numbers, we have a bit of a data problem to address. The lack of sustained, high inflation in the developed markets since the mid-80s has been good news for consumers, but bad for this article. Bad because there has been an explosion of investable instruments over the last 20 years, but no real good bouts of inflation by which we can judge them.
Where is this constraint binding? Unfortunately, in many of the most interesting assets. Neither oil nor gold prices were market based in 1970 at the beginning of the most recent major inflationary period. The REIT index, the easiest way to think about real estate as a hedge, only goes back to 1972. U.S. inflation indexed bonds only began trading in the 1990s.
The result is that while I would love to have only one chart and one table, the sad fact is that that would be either misleading or leave out valuable data, so I will beg your indulgence and show multiple exhibits with different time frames.
WHAT DO WE WANT IN AN INFLATION HEDGE?
What do we mean when we talk about protecting from inflation? One thing you could do is just look at asset returns adjusted for inflation over the long run. What you will find is that whatever does the best in nominal (that is, unadjusted for inflation) terms will also do the best in real (inflation adjusted) terms.
As is well known, during most long periods in the United States stocks have the highest returns, so in an uninteresting sense and over a long enough period, stocks could be your inflation hedge.
But when we think a bit more precisely about what we can add to a portfolio for a limited period to hedge against inflation when we are particularly concerned, we want an asset that will experience a large positive return when inflation increases, or have a high correlation to inflation. Relatedly, we might be interested in highlighting those assets which might do particularly poorly during a sustained inflationary period.
Inflation, of course, directly erodes the value of a dollar denominated asset, but how does inflation affect the price of securities? Increases in expected inflation and its volatility (that is, how unpredictable inflation is) both tend to push real rates up. Since nominal interest rates are real rates plus expected inflation, a spike in inflation can be a double whammy to assets by both a higher discount rate and a decline in real value.
Returns in the Great Inflation, 1970-1985
With our caveats behind us, let’s delve into the numbers for some assets. First, we’ll limit our examination to our last period of sustained inflation. This table gives returns over the period of what we see as being the last great inflation: 1970-1985
| ANNUALIZED ST DEV | WORST DRAWDOWN | ANNUALIZED RETURN | |
| REAL BOND RETURNS | 8.70% | -45.00% | 1.60% |
| REAL BILL RETURNS | 1.40% | -12.50% | 1.40% |
| REAL S&P RETURNS | 15.80% | -52.30% | 2.80% |
Table 1, Returns in CPI adjusted Prices, 1970-1985.
The main lesson here is about how much risk you had to endure in either the bonds, whose high coupons may have been enticing, or stocks, which did outperform but at a very high cost in terms of risk. In this period, I think shortening duration looks attractive, and it would also make sense to re-evaluate how much risk you would be willing to take in equities.
Returns 1975-2021
Now let’s consider a few more assets over a longer period 1975-2021, with the inclusion of REITs and gold. Note that we now begin in 1975 rather than 1970 to include these assets in our analysis.
| ANNUALIZED ST DEV | WORST DRAWDOWN | ANNUALIZED RETURN | |
| REAL BOND RETURNS | 11.00% | -47.70% | 4.50% |
| REAL BILL RETURNS | 1.20% | -19.50% | 0.90% |
| REAL S&P 500 RETURNS | 15.00% | -54.20% | 8.60% |
| REAL GOLD RETURNS | 18.50% | -82.70% | 1.30% |
| REAL REIT RETURNS | 16.80% | -69.60% | 9.50% |
Table 2, Returns in CPI adjusted Prices, 1975-2021. Bonds: Active U.S. treasury 10 year bond, Bills: U.S. treasury 3 month bill, gold: spot gold price, REIT: FTSE NAREIT All Equity REITS Index Source: Bloomberg, Federal Reserve bank of St. Louis, Robert Shiller, Astor calculations
With this analysis in hand, let’s move to some general conclusions about each asset over this timeframe.
BONDS
Inflation is rightly considered to be the scourge of bonds. The longer the maturity the bond, the worse it returns during above average inflation. Long-term bonds (as reflected in ETFs such as TLT or IEF) have a negative correlation to monthly inflation: that is, you can expect to lose capital because of price declines as well as have the real value of your portfolio be eroded by inflation. In the event of higher inflation, a nominal treasury bond portfolio is about the worst thing you could have, and if you are trying to guard against inflation the first thing I would suggest for you to consider is reducing the duration of your portfolio. Daring investors might want to investigate inverse treasury funds (such as TMV), but typically the steepness of the yield curve is such that it is difficult to be profitable short the bond market and such positions should have meticulous risk control.
TREASURY BILLS
Given the damage inflation does to ten-year bonds, one might be inclined to forget about the fixed income market altogether. However, that would be a mistake in my opinion as I believe short-term fixed income instruments offer some of the best protection against inflation. While bill prices decline as inflation surprises are realized, the pain is short lived and as the Treasury offers bills weekly at new higher yields you are only behind the curve for a limited period of time.
Given that U.S. Treasury bills are generally though of as “risk free”, I believe that reducing long duration assets such as conventional bonds or stocks into bills (such as SHV or BIL) for as long as any fears last is a suitable option for inflation-worried investors to explore. The forgone returns should be thought of as the price one is paying for insurance.
In the painful inflationary period of 1970 – 1985 ten-year bonds and three-month bills earned about the same return (about 1.5% per year) but bonds had a much rockier ride with a 45% real drawdown vs a drawdown of about 13% for three-month bills (See Table 1 – returns adjusted in CPI prices).
Note that today’s rates are not as close to the inflation rate as were the bills in the 1970s, however.
GOLD
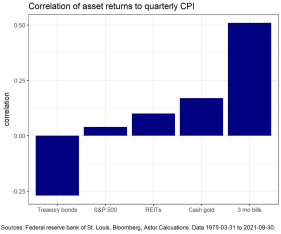
I do not think gold’s reputation as an inflation hedge is entirely deserved. The real return of physical gold comes 4th out of 5th on our list of assets, only slightly above the much less volatile T-bills over the period studied. In addition, it has only a modest positive correlation to quarterly inflation. We will see in the chart below that the correlation to inflation has been lower in the recent period.
STOCKS & REITS
In “ancient times”, the 1960s, finance professors believed that stocks should be a good inflation hedge because they represent ownership in real assets (factories) and the profits they will produce. Then came the so-called Great Inflation. US equities, as measured by the S&P 500, produced about zero real return with substantial volatility and eye watering drawdowns over that period.
The current consensus, as described in a paper Inflation Hedging for Long Term Investors by Attie and Roache, is that stocks are a better long run inflation hedge than short run. According to our criteria above, stocks tend not to have a high short-term correlation to inflation but may recover over longer periods. If we think of the dividend discount model of stocks this makes sense. As inflation increases, returns demanded throughout the financial system increase, meaning that new investors demand a higher expected return to purchase an asset today.
When you first hear “returns to increase” it sounds good, then you realize that the way to increase expected return and lure in new buyers is to lower the price. If you are already in the asset, higher expected returns in the hazy future may be cold comfort. But over long periods, stocks are calls on the productive capacity of real assets and should eventually recover from inflation.
Real Estate Investment Trusts (“REITs”) (represented by such ETFs as VNQ and IYR) have a similar pattern to stocks, with slightly higher returns over our period as well as a slightly higher correlation to inflation.
RETURNS 1997: ADDING TIPS + COMMODITIES
In the more recent period, we have still more viable choices. These exhibits add TIPS and crude oil futures.
| ANNUALIZED ST DEV | WORST DRAWDOWN | ANNUALIZED RETURN | |
| REAL BOND RETURNS | 10.80% | -21.40% | 4.80% |
| REAL BILL RETURNS | 1.10% | -19.50% | -0.30% |
| REAL S&P 500 RETURNS | 15.30% | -54.20% | 7.20% |
| REAL GOLD RETURNS | 16.30% | -44.80% | 4.60% |
| REAL REIT RETURNS | 19.60% | -69.60% | 7.60% |
| REAL CRUDE OIL FEATURES | 40.00% | -98.30% | -5.50% |
| REAL TIPS RETURNS | 5.30% | -13.90% | 3.20% |
Table 3, Returns in CPI adjusted Prices, 1997-1985. Bonds: Active US 10 treasury year bond, Bills: US treasury 3 month bill, gold: spot gold price, REIT: FTSE NAREIT All Equity REITS Index. Crude oil continuous first NYMEX crude oil contract, TIPS: Bloomberg US Treasury Inflation-Linked Bond Index Source: Bloomberg, Federal Reserve bank of St. Louis, Robert Shiller, Astor calculations
IPS – INFLATION PROTECTED BONDS
Treasury Inflated Protected Securities (“TIPS”) are bonds issued by the US Treasury whose principal (that is, final) payment increases with the CPI, so by law they will hold their value no matter the level of inflation. Somewhat counterintuitively, however, the correlation between TIPS prices and inflation is only modest.
A rise in inflation causes two countervailing forces on the price of TIPS. The rise in inflation makes the amount paid at maturity higher, which is good for the bond price (ex. you bought the bond for $100 and you are getting paid back $105). However, the price in the secondary market is dependent upon real yields. As the volatility of inflation increases real yields may rise – offsetting the increased principal. We can see this in the first six months of 2021 where the total returns on the TIP ETF were just 1.5% even though the inflation rate increased from 1% to 5%. Now, that is still better than the 2% loss in the Bloomberg Barclays U.S. Aggregate Bond Index, but investors will need to decide if those returns are enough.
If an investor has a specific obligation to pay in the future which they need to be sure can keep pace with inflation, then I think buying an inflation protected bond with a maturity that matches the liability is a reasonable move, as the changes in real yield changes are less important. However, if you buy a security (such as an ETF) which aggregates several individual bonds, then the real yield changes could swamp your inflation advantage when it comes time to sell the ETF.
CRUDE OIL
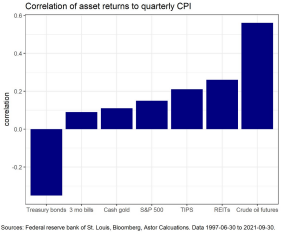
The financial instrument that I found in my research with the highest correlation to inflation is uncollateralized crude oil futures. If you believe that there is going to be a spike in inflation, I think buying crude oil futures or the equivalent in ETF form (USO) could be a useful addition to a portfolio. Of course, this is in part because energy costs are typically all correlated, so the crude oil price actually is inflation in some sense (and certainly in the sense that energy spikes are the price changes most noted by consumers).
Note, however, that a constant long in crude oil futures from 1997 to 2021 would lose money (both nominal and real) due to the cost of the shape of the crude oil curve over that period. Hence I think any forays into crude should be high conviction and probably short in time duration.
COMMODITY INDEXES
You may see charts floating around showing how well commodity indexes like the S&P GSCI did in the 1970s and 1980s. My advice is to ignore these, as the indexes in the high inflation period were mainly agricultural futures which have very different return characteristics than energy. In addition, those returns are in large part the return on the assumed collateral, which is to say the T-bills which we have looked at separately above. There is no need to combine bill and commodity returns.
One aspect of futures that I like is the low outlay of initial capital: the margin is usually less than 10% of the notional value of the contract*. Thus, if you wanted to put on a crude position of 10% of your portfolio (which would be pretty large) with crude oil futures you could do that for approximately 1.0% of the portfolio assets (i.e. 10% x 10%). In a sense, you can basically keep your core portfolio intact and bolt the futures part onto the side.
*Futures involve increased risk due to the inherent leverage from the low initial capital requirement and high notional value of the contracts. Margined securities can be subject to margin calls if they experience losses beyond a certain level which can require significant capital outlay to cover and may result in higher losses than more traditional investments.
CRYPTO
Finally, what about that darling of pandemic era, crypto? Here our data problems are even worse as bitcoin has only been around about ten years. Should cryptocurrencies act as an inflation hedge in theory? Well, probably not, as in theory no one would want to own an asset that has no cashflows and is expensive to trade. But you could say the same thing about gold, and people have been happily trading that for a long time. If enough people think bitcoin will be a good inflation hedge, then it probably will be due to momentum from increased demand. How has it done in its short life? Over the period 2011 to Q3 2021 the quarterly correlation between bitcoin and US CPI was about 0.1, a bit less than gold (0.14) or TIPS (0.2) over that period. If you have a reason to want to hold bitcoin, I don’t see a great inflation argument to talk you out of it. Likewise, if you are anti crypto I don’t think its record of inflation hedging will change your mind.
CONCLUSIONS
We are, of course, not giving investment advice here, and everyone should consider their own circumstances before hedging. However, there are a few rules of thumb I consider in thinking about inflation hedging:
- The more an investor is concerned about capital preservation, the more that simply lowering duration makes sense to me.
- For longer bouts of inflation adding TIPS can make sense as well.
- For return maximizing accounts, increasing equity exposure as well as reducing the duration of fixed income components is an option to review.
- If a risk tolerant account has a very high confidence forecast of a burst of inflation lasting only a few months, there are ETFs which offer the equivalent of selling bond futures or buying crude oil futures, though the risks of these positions should be carefully monitored.
Originally published by Astor Investment Management.
For more news, information, and strategy, visit the ETF Strategist Channel.
DISCLOSURES
Astor Investment Management LLC (“Astor”) is a registered investment adviser with the Securities and Exchange Commission. This is not a solicitation to offer investment advice or services in any state where to do so would be unlawful. Analysis and research are provided for informational purposes only, not for trading or investing purposes. All opinions expressed are as of the date of publication and subject to change. They are not intended as investment recommendations. These materials contain general information and have not been tailored for any specific recipient. Astor and its affiliates are not liable for the accuracy, usefulness, or availability of any such information or liable for any trading or investing based on such information. There is no assurance that Astor’s investment programs will produce profitable returns or that any account will have similar results. You may lose money. Past results are no guarantee of future results and no representation is made that a client will or is likely to achieve results that are similar to those shown. Any particular client may experience results different from other clients. Factors impacting client returns, results, and allocations include account inception, money transfers, client-imposed restrictions, strategy and product selection, fees and expenses, and broker/dealer selection, as well as other factors. An investment cannot be made directly into an index. Please refer to Astor’s Form ADV Part 2A Brochure for additional information regarding fees, risks, and services.
Bloomberg Barclays U.S. Aggregate Bond Index: The Bloomberg Barclays U.S. Aggregate Bond Index is a broad-based index representing the dollar denominated, investment grade bond market and includes Treasuries, government securities, and mortgage securities.
Correlation: A statistic that measures the degree to which two securities move in relation to each other.
Drawdown: is the peak-to-trough decline during a specific recorded period of an investment.
FTSE NAREIT All Equity REITS Index: The FTSE NAREIT All Equity REITS Index is a market-capitalization index of U.S. equity REITs.
Standard Deviation: A measure of the degree of variation of returns around the mean (average) return. The higher the volatility of the investment returns, the higher the standard deviation.
Standard & Poor’s 500 Total Return Index: The S&P 500 Index measures the performance of 500 large cap stocks, which together represent approximately 80% of the total equities market in the United States. The total return calculation includes the price-plus-gross cash dividend return. The S&P 500 is registered trademark of McGraw Hill Financial.
Astor currently holds positions in TIP, SHV, and VNQ within its portfolios but does not hold USO, TLT, IEF, or TMV in any portfolios. Astor does not provide specific advice about investing in any of the mentioned ETFs within this text. Investors should consult with a financial professional and review the applicable prospectus for each fund prior to investing to gain an understanding of fund objectives, risks, fees, and expenses.