

By Deepika Sharma, Astor Investment Management
For decades, investors have been interested in factors—attributes such as value, momentum or market capitalization. But as investors have also experienced, as certain styles or themes go out of favor, factors typically go through periods (and potentially extended periods) of underperformance.
Now, investors are looking more closely at factor rotation, shifting from, say, growth to value, or overweighting low volatility stocks rather than value stocks.
But how? In the short term, the best way to avoid underperformance in any particular factor is with diversification rather than tactical timing. For the medium and long term, however, there is evidence that using macroeconomic and other risk-based approaches may be effective for factor rotation.
Why do Investors Want Factor Rotation?
The potential for factor rotation appears to come at a good time as index-based factor investing in U.S. equity markets has proliferated. But there appears to be a widespread temptation among investors to time exposure based on what seems to be currently in favor. This attempt to choose factors is not without reason, as past performance shows that even established factors can, occasionally, underperform for long periods. The classic example is value, as illustrated in Exhibit 1, which has historically done better than growth. But there are marked periods when growth beat value by as much as 11.4% in one year.
Exhibit 1 – Rolling Five-Year Annualized Returns of Value minus Growth Factor (1956- February 2017).

Source: Fama French Data, Astor Calculations
Not only can factors underperform based on market conditions, different factors also offer varied risk-return profiles. As shown in Exhibit 2, the five single factors most commonly used by investors—value, momentum, size or market cap, quality, and minimum volatility— all have very different average return and volatility compared to the broad market index.

Exhibit 2 – Average Annualized Returns and Volatility (Standard Deviation) of Single Factor Indices
In addition, one factor can be relatively more attractive for a short time period. For example, during the market contraction that lasted from December 2007 to June 2009, the Russell 1000 Low Volatility factor outperformed the value factor by 12%. In the last two years, however, the two indices have tracked much more closely (Exhibit 3).
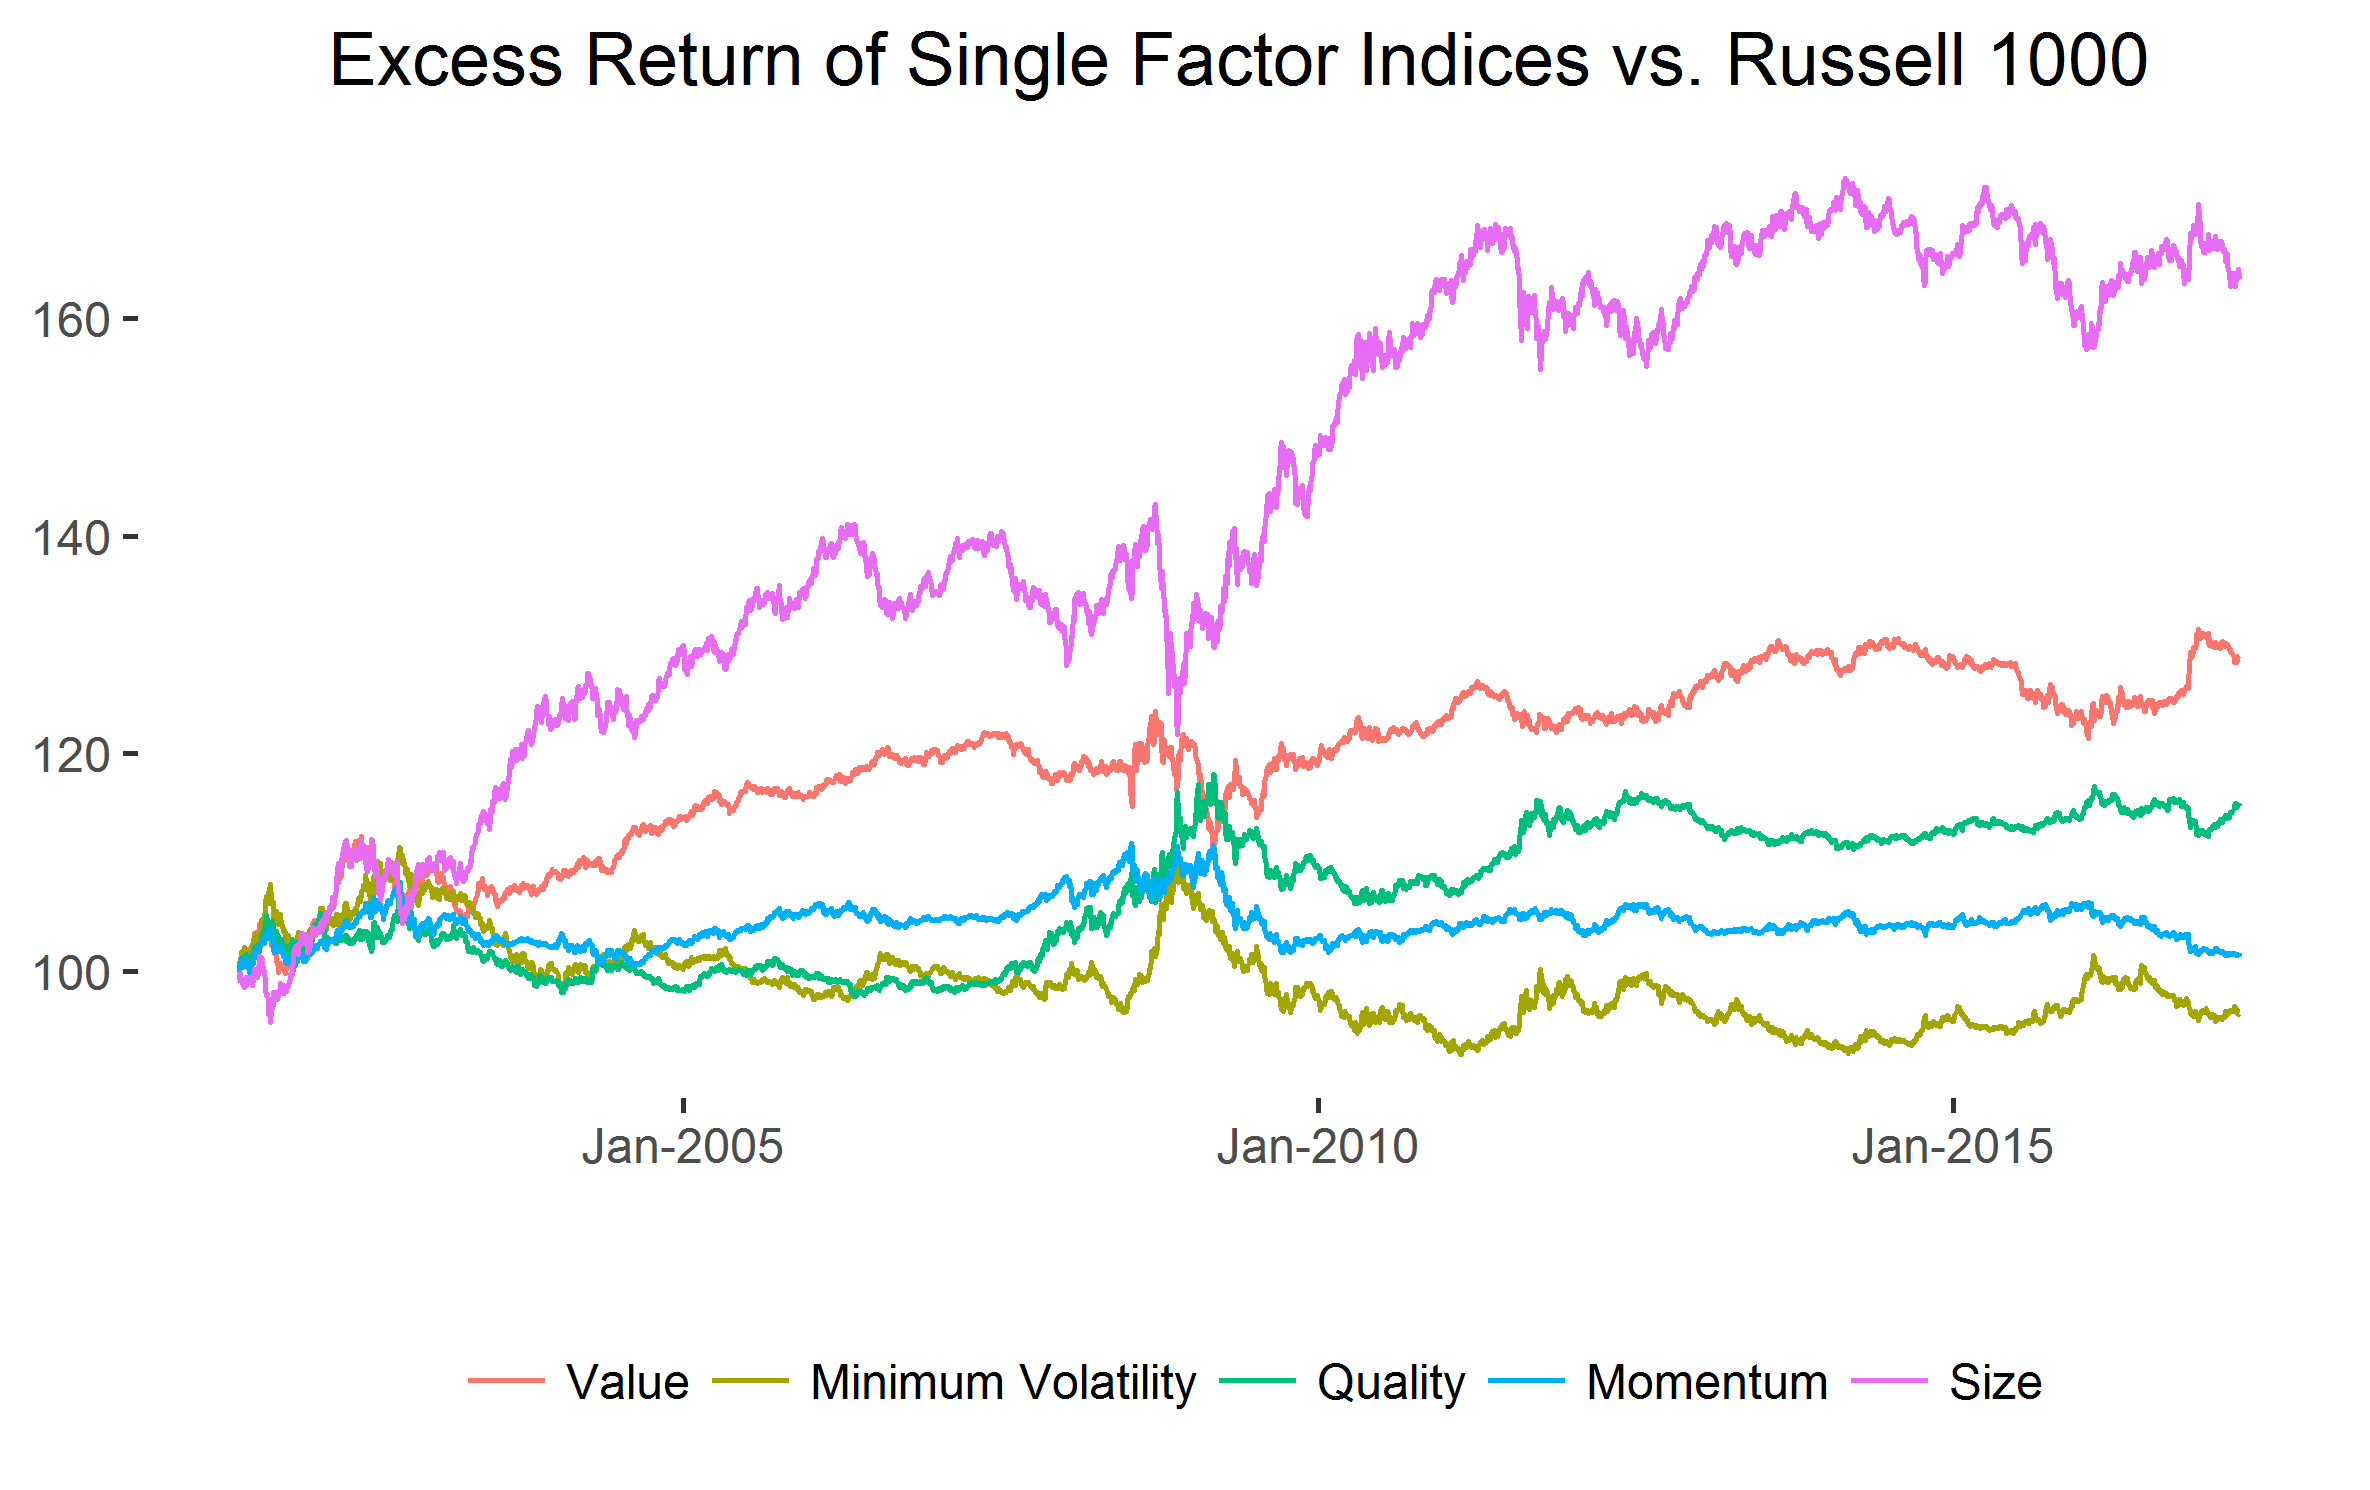
Exhibit 3 – Excess Returns of Single Factor Indices compared to Broad Market Equivalent
Value is represented by Russell 1000 Value Factor Index, Minimum Volatility is represented by the Russell 1000 Low Volatility Factor Index, Quality is represented by the Russell 1000 Quality Factor Index, Size is represented by the Russell 1000 Size Factor Index, Momentum is represented by the Russell 1000 Momentum Factor Index.
Can Factors Be Timed?