

By Rod Smyth, RiverFront Investment Group
In our view, this is one of the most asked and most relevant questions in investing and has been for decades. It sounds like a simple “active versus passive” debate (on which we present some data), but through follow-up questions to those who have asked us, right now many are really asking, “Should one just buy the S&P 500 instead of this diversified global portfolio, which has had lower returns for the last six years”?
This week we will try to answer both questions. Before doing so, we want to stress that, in our view, an index is only a piece of the investment puzzle, so we think the bigger question is: which index (there are many indexes and construction methodologies), and what portion of assets should be invested in it? As we have said before, an index does not solve the puzzle of how to divide one’s savings between cash, stocks, and bonds, to name just three.
We are users of index funds as a part of an active management strategy because we recognize that in strong up-trending markets they are hard to beat (see chart below). However, because they offer no downside protection and no advice, in strong down-trending markets, they offer no peace of mind and no risk mitigation, in our view. We want to shout, “Where were the advocates of index funds in 2010, following the “lost decade” for stocks, when the S&P 500 fell from 1400 to 1100 over the prior 10 years”? In our experience, enthusiasm for passive investment increases after strong bull markets such as the late 1990’s and the last couple of years. We are cautious about excessive enthusiasm for the S&P 500 following a 9 year period (Feb 2009-Feb 2017) that has seen the index compound at nearly 18% per annum. Our chart below shows that long-tenured active large-cap managers have tended to achieve performance above the S&P 500 when the S&P 500 experienced lower returns. We interpret this data to suggest that if returns moderate, as we expect, then the pendulum will swing back in favor of active management. Past performance is no guarantee of future results.
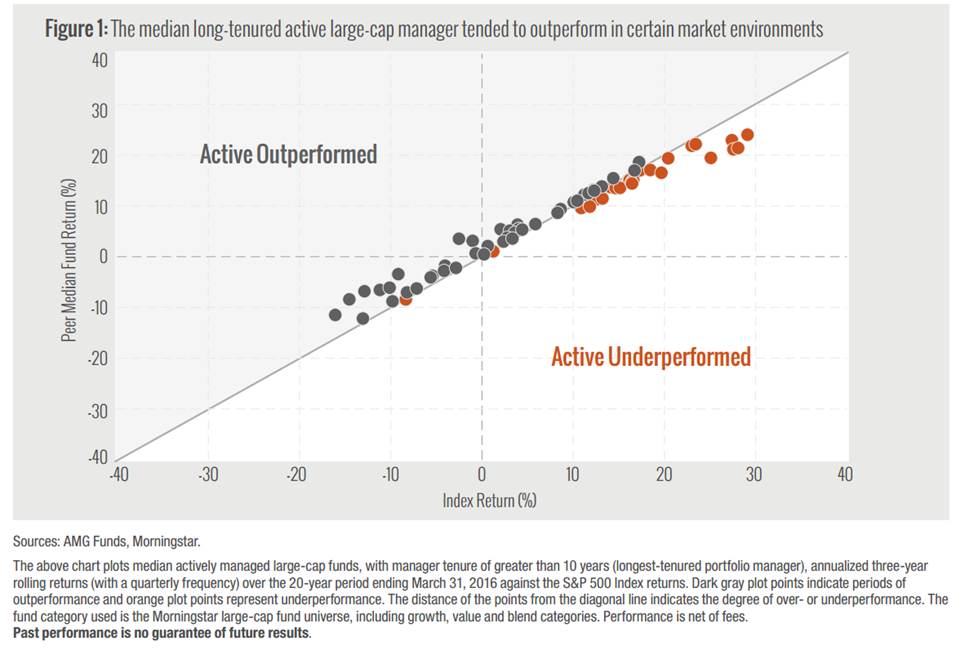
Source: AMG Funds, Morningstar. For more information on the chart above, please see AMG Funds, “When Active Management Matters Most”, dated June 2016. From report, “The above chart plots median actively managed large-cap funds, with manager tenure of greater than 10 years (longest-tenured portfolio manager), annualized three-year rolling returns (with a quarterly frequency) over the 20-year period ending March 31, 2016 against the S&P 500 Index returns. Dark gray plot points indicate periods of outperformance and orange plot points represent underperformance. The distance of the points from the diagonal line indicates the degree of over- or underperformance. The fund category used is the Morningstar large-cap universe, including growth, value, and blend categories. Performance is net of fees. Past performance is no guarantee of future results.” The above is provided for illustrative purposes only and not intended as an investment recommendation.
The chart on page 1 needs further explanation. The horizontal grey line represents the index return for annualized 3-year rolling returns over a 20-year period ending in March 2016. The dots represent the average return of a group of large-cap active managers (with manager tenure of more than 10 years) compiled by Morningstar. When the dots are above the horizontal grey line, the active group, net of fees, has outperformed versus the grey line. We see two main messages in this data. First, out of 15 rolling 3-year periods that were negative, active outperformed in 14 of them; but, in all 10 periods when returns were above 18%, the index did better. In the middle, active also has done slightly better. This reinforces the idea that an index is a momentum vehicle, in which a stock’s weighting is simply a function of the success of its share price and a value judgment plays no part in an index. As a result, a manager who is making value judgments often struggles in strong-trending markets when ‘overvalued’ stocks get more overvalued. Our second observation is how tightly bunched the dots are, which stresses our point about asset allocation. It certainly seems from this data that the decision between active and passive has been less important than a judgment about future returns, as the range of 3-year outcomes over this 20-year period has been very wide, from -15% to +30%.
Studying the history of market cycles shows us that, in every major cycle that we have studied around the world, investors’ emotions frequently cause them to react to performance: selling after market declines (especially big ones) and buying following market advances, especially long persistent gains – the opposite of buying low and selling high. Our chart below shows the relative performance of the US versus the rest of the world. Over time, they have performed similarly but in cycles. You can clearly see the most recent cycle of US underperformance from 2002-2007 and outperformance since 2011. Following 6 years of outperformance by the US, we think now is the wrong time to abandon a global strategy, as US stocks are close to their highest relative level in the last 20 years.
The weekly chart: last 6 years has driven the Us close to relative high
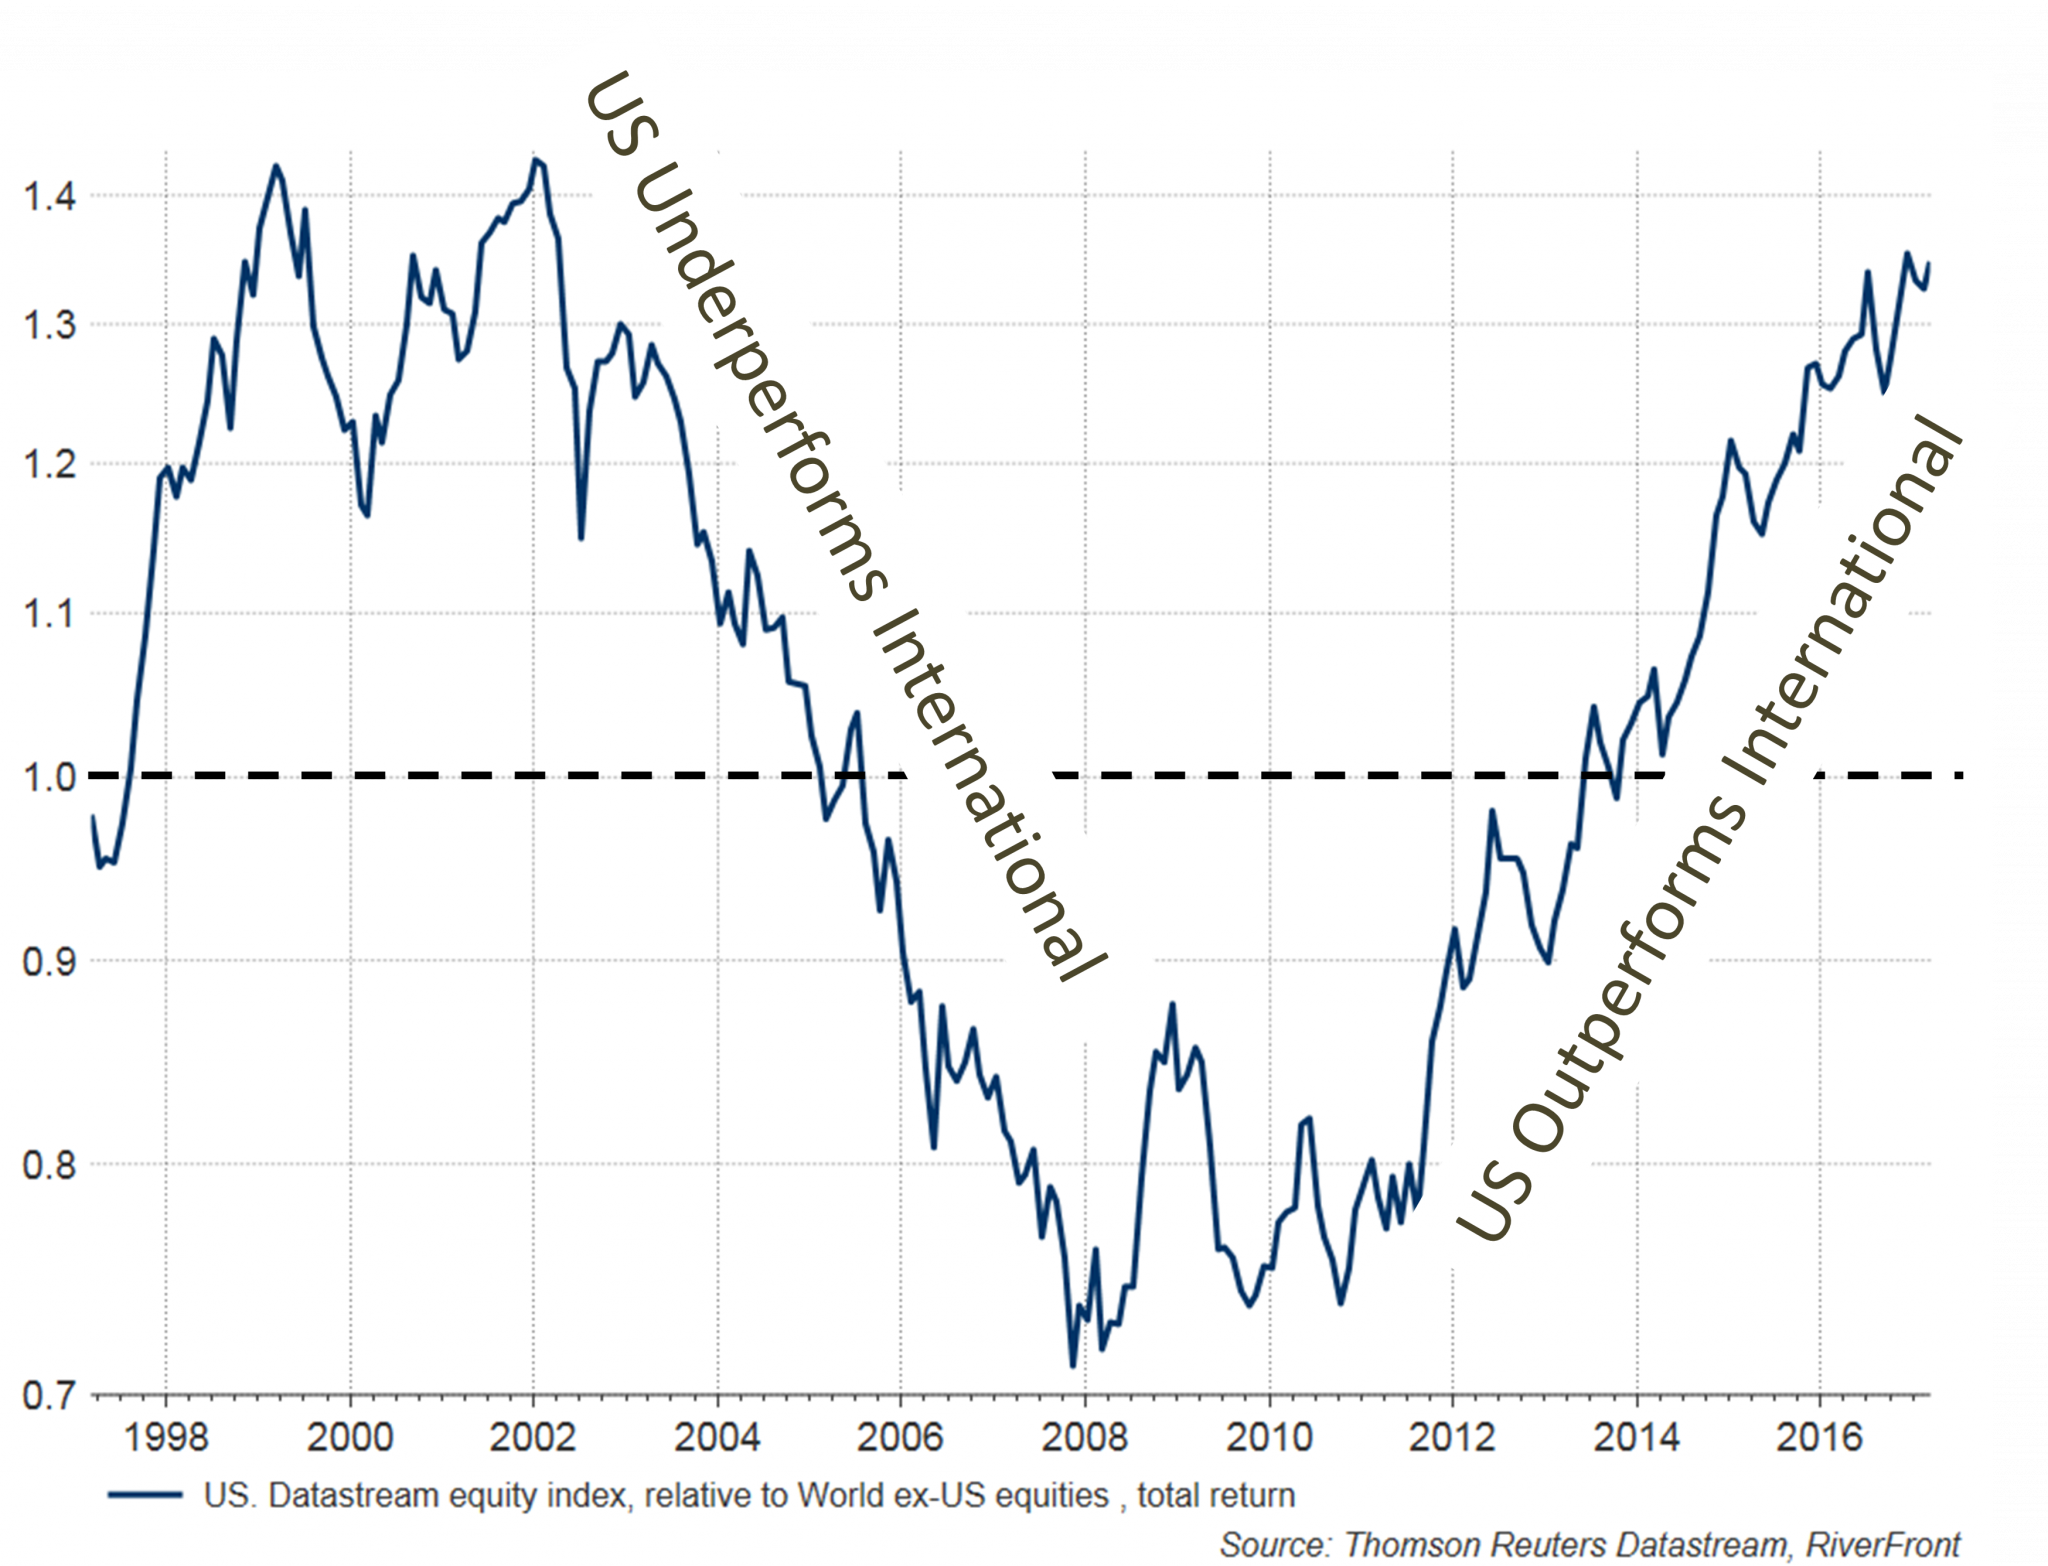
Source: Thomson Reuters Datastream, RiverFront Investment Group. Past performance is no guarantee of future results. Please see below for important disclosure information. The above is provided for illustrative purposes only and not intended as an investment recommendation.
Rod Smyth is the Chief Investment Strategist at RiverFront Investment Group, a participant in the ETF Strategist Channel.
Important Disclosure Information
Past results are no guarantee of future results and no representation is made that a client will or is likely to achieve positive returns, avoid losses, or experience returns similar to those shown or experienced in the past.