

For all the resources and effort investors pour into seeking an edge over the stock market, we believe those who focus on traditional stock selection and style factors often overlook one of the most useful potential tools for generating outperformance: sector allocation.
Companies are grouped within sector classifications explicitly because of the similarity of their economic activities. It follows that companies within a given sector are likely to have similar or correlated fundamental outcomes under a particular set of economic conditions. Conversely, companies in different sectors, which represent different types of economic activities, will typically have differing fundamental outcomes for a given economic environment. These divergent fundamental outcomes contribute to divergent equity sector performance, which, in turn, creates the opportunity for generating excess return through sector allocation.
If you subscribe to our belief that the economic environment is one of the key drivers of financial market returns, it doesn’t take much to imagine that sector allocation should offer better opportunities for generating outperformance than other types of allocation strategies.
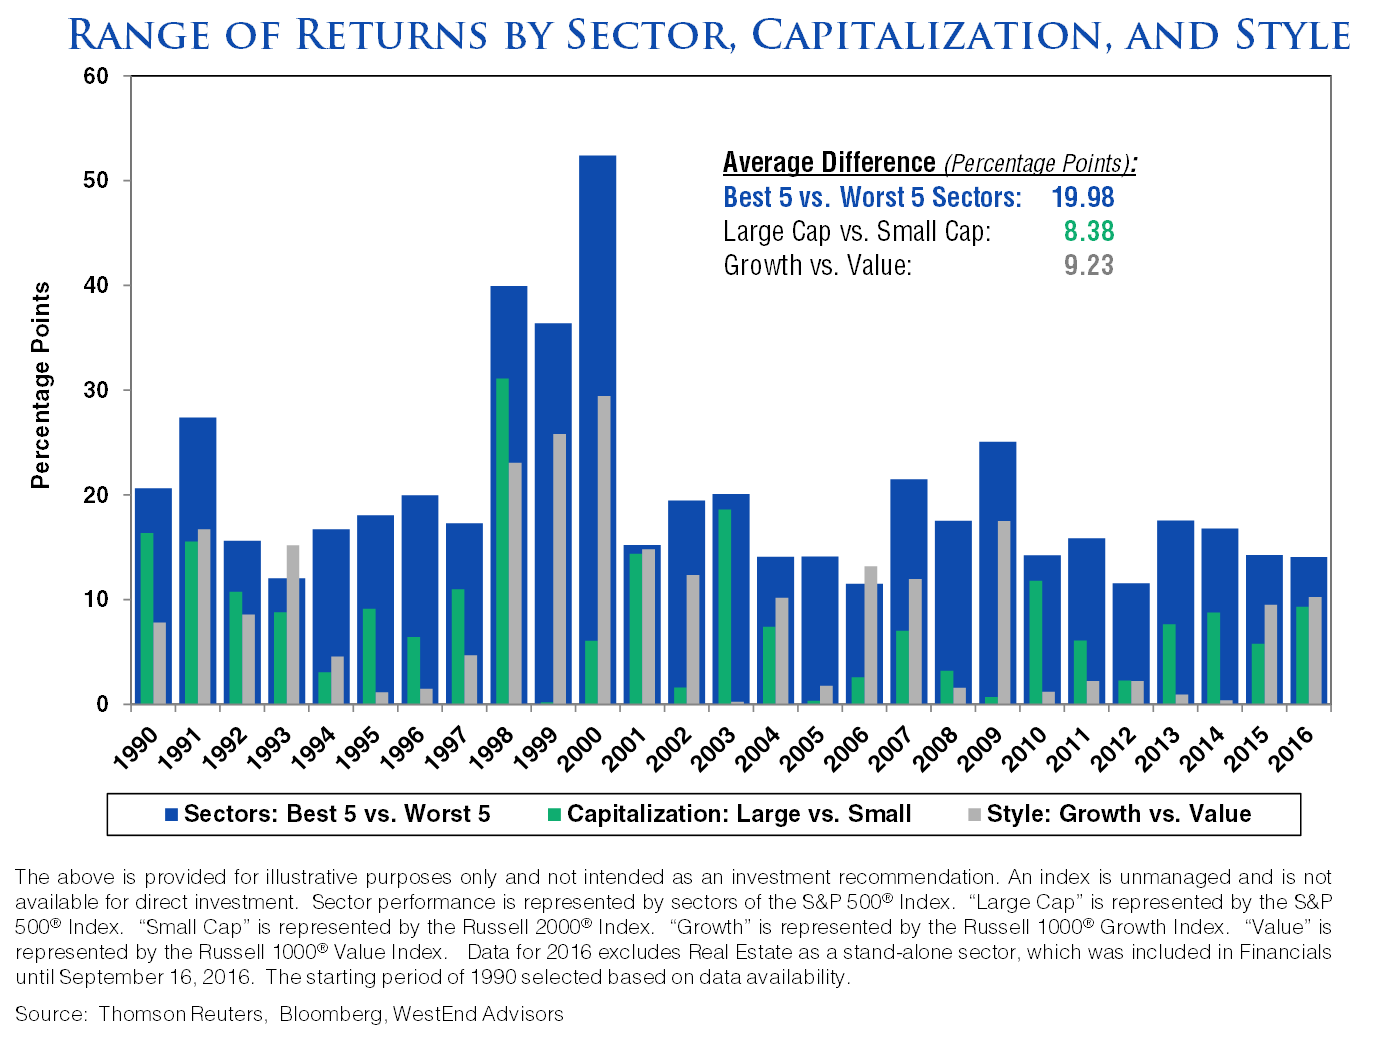
To illustrate this, first consider two common equity style pairings investors seek to exploit: Large-cap versus Small-cap and Growth versus Value. Using the S&P 500 as a proxy for Large-cap and the Russell 2000 for Small-cap, the absolute calendar-year performance spread averaged 8.38% from 1990 through 2016. Similarly, for Growth versus Value, the absolute annual spread between the Russell 1000 Growth Index and Russell 1000 Value Index averaged 9.23%. Thus, tactically allocating between Growth and Value or between Large-cap and Small-cap allows the potential for an investor to capture some of that performance spread as excess return.
Now consider the potential from allocating among S&P 500 sectors over the same period. Comparing the average return of the five best-performing sectors versus the average return of the five worst-performing sectors each year, the performance spread averaged 19.98%. That is more than twice the spread of either the Growth/Value or Large-cap/Small-cap pairings. Additionally, there is consistency to the relative size of the sector performance spread. The sector performance spread was larger than either the Growth/Value or Large-cap/Small-cap spread in 25 of 27 calendar years since 1990. This combination of consistency and a large performance spread makes sector selection fertile ground to plant the seeds of active management in an effort to reap attractive risk-adjusted returns over time.
Of course, no investor is going to always pick what prove to be the best five sectors for a given period, just as no investor is going to perfectly time when to be in Growth stocks versus Value stocks or Large-cap versus Small Cap. However, if sectors tend to offer a larger performance spread than style factors, it seems intuitive that a skilled sector-allocator may be able to achieve greater excess return over time than an equally-skilled style-allocator.
What also seems intuitive, though perhaps underappreciated, is the potential for investors to take advantage of the opportunity in sector allocation through economic analysis. As previously mentioned, companies are explicitly grouped into sectors based on the similarity of their economic activities and drivers. More importantly, economic fundamentals shift with the progress of an economic cycle, and thus the relative attractiveness of the eleven sectors will change as the economic cycle evolves. Understanding how sector performance relates to the economic cycle provides a basis for making informed sector allocation decisions.