By Shundrawn A. Thomas, President of FlexShares
Investing can be complex. As an investor, you are continually confronted with new opportunities and challenges. What’s more, providers offer an ever increasing array of investment products to capitalize on opportunities and address challenges.
Simplicity is one of our core values at FlexShares. We believe our investment solutions and insights should be easy to understand.
Whether thoughtfully communicating the science behind our investment strategies, or providing cogent investment insights, we strive to simplify the investing experience. Sir Isaac Newton observed that truth is ever to be found in simplicity. We find that simple, yet deliberate, disciplines produce truly innovative investment solutions. Likewise simple, yet careful, exploration produces valuable investment insights. To this end, I offer the following perspectives on the ETF marketplace.
My hope is that these unique insights will help simplify your investment experience and encourage your ongoing engagement with FlexShares.
Industry Overview
Exchange-Traded Funds (ETFs) continue to be among the fastest growing product categories in the U.S. asset management industry with a 10-year CAGR of 19.45%. In 2016, growth in the U.S. market increased +19.84% from the prior year to $2.55 trillion in assets as of 12/31/2016.
The total assets at year-end (YE) represented a record total for the industry buoyed by record flows of $284 billion.
2016 flows were driven primarily by U.S. equity (+$168 billion), which more than doubled its inflows from 2015.
Taxable bonds finished with the second most inflows (+$85 billion), which also marked its largest annual inflow ever up from (+58 billion) the prior year. ETFs continue to gain market share among pooled vehicles in the taxable bond category as evidenced by the comparison to the (+$113 Billion) of inflows for taxable bond mutual funds.
Commodities saw the next highest (+$10 billion) as gold strategies were in favor in the early part of 2016. Over the final quarter of the year, however, gold products experienced notable outflows as investors re-allocated to equities and to broader based natural resources exposure.
While this dampened overall commodity flows relative to the start of the year, the overall results were positive.
International equity, which was the star last year, attracted significantly lower flows (+$9 billion) as investors reduced exposure to developed international markets and currency hedged strategies.
Nonetheless, when correcting for the size of the markets, international equities favored emerging markets. Investors in U.S. equites continued to favor the ETF vehicle structure as U.S. equity mutual funds experienced outflows of (-$91 billion).
In 2016, there were 246 new U.S. ETF listings but 124 fund closures, bringing the YE fund total to 1,972. This represented a record number of closures albeit from a larger base. There was more concentration of fund flows among the top 3 providers as they accounted for $254 billion, or 90% of fund flows. This compares to 66% during the prior year. One of the biggest drivers in this year-over year shift was the rebound at a major competitor from annual outflows in the prior year.
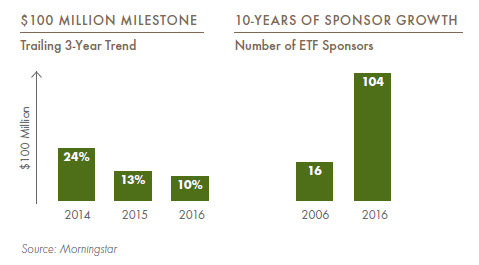
Achieving $100 million in AUM within two years of listing for a new fund is an accepted measure of initial success. A decade ago, nine out of ten ETF listings achieved this milestone versus about one in ten today.
During the past two years, 534 new ETFs were listed with 54 (10%) of these funds exceeding the $100 million AUM milestone. This ratio decreased from 2015, when 13% of funds launched within the trailing two years exceeded the $100 million milestone.
Competition continues to intensify as new players enter the market. We assert that the keys to success in our industry are evolving due to changing investor attitudes and competitive dynamics. The number of U.S. sponsors has increased from 16 at the end of 2006 to 104 at the end of 2016. A net increase of 13 sponsors occurred in 2016.
Product Innovation
From my perspective, there are four distinctive phases of product innovation in the exchange traded funds market.
The first stage focused almost exclusively on broad-based equity benchmark indexes. Institutions were the initial users of these benchmark indexes in tactical applications, such as hedging and transition management.
Over time, usage migrated to advisors and other strategic investors, along with products designed to track benchmark indexes, which continue to account for the majority of ETF assets.
The second stage of innovation was distinguished by an expansion into a variety of asset classes including fixed income, commodities and real estate. Driven by investor demand for global portfolio exposure and rising demand from advisors, ETFs democratized access to these asset classes. This stage of innovation was also marked by rising awareness and usage among retail investors. The third leg of innovation has been distinguished by investor demand for distinctive investment strategies with particular interest in funds that track alternatively weighted indexes.
A variety of nomenclature is associated with these strategies including fundamentally weighted, factor weighted and the popular “smart beta.” While the lexicon may vary, the trend of growing investor demand for alternatively-weighted index strategies is firmly established. The term “smart beta” is increasingly being used by investors and Morningstar® identifies 634 funds with the term “strategic beta,” up from 515 funds the prior year. With assets of $559 billion and inflows of $50 billion in 2016, this sub-segment continues to experience strong organic growth. It is relevant to note that flows to strategic beta* funds fell short of the prior year modestly outpacing the industry growth rate (21% versus 20%).
FlexShares is a leader in this segment with 23 of our 25 funds tracking alternatively weighted indices.
New stages of innovation are generally ignited in the midst of an ongoing phase. The drive toward investment strategies that efficiently capture compensated risk factors and active risk,has accounted for much of the interest in alternatively weighted index strategies. This trend, coupled with continued fee compression, has given rise to a fourth stage of innovation. The fourth stage of innovation is characterized first by budding interest in actively managed ETFs. Secondarily, it is characterized by rising
interest in multi-asset class solutions, in which ETFs are the preferred fulfillment vehicle. Actively managed ETFs were first introduced to the market in 2008. At the close of 2016, there were 169 U.S. listed and actively managed ETFs with $30 billion inassets. While the number of new funds continues to grow, active ETFs only account for just over 1 percent of U.S. ETF assets.
Broader utilization of actively-managed ETFs will be aided by targeted regulatory relief, market entry by established active fund managers and the tried and true passage of time. Additionally, asset managers are offering increasingly popular multi-asset class products and managed portfolio solutions comprised of ETFs. These solutions may incorporate dynamic or tactical asset allocation and may integrate active and passive components.
The trend toward multi-asset class products is a key driver of the emerging fourth stage of product innovation. This phase of innovation is blurring, if not removing altogether, industry distinctions between active and passive portfolio solutions.
Our product strategy at FlexShares remains principally focused on alternatively weighted index strategies with selective implementation of actively managed strategies.
The FlexShares’ philosophy is built around the way investors think. Investors have clear objectives. We develop investment strategies that seek to meet those objectives. When it comes to delivering an index-based strategy, the index matters. This is why our comprehensive approach, known as Flexible Indexing, entails innovative index construction for each FlexShares fund. The entire development process is centered on investor needs.
Click here to view the full FlexShares President’s Perspectives whitepaper.