It is no secret that active management has been increasingly critiqued in recent years, and asset flows are following suit as investors move to passive products.
One of the large recipients of these flows is index-based, quasi-active, smart beta and factor strategies that deliver returns of active managers, but at a fraction of the cost.
Historically, many of these factors have outperformed in nearly all environments – an impressive track record, but one that may be challenged as more assets move into the space.
However, we’ve written extensively on a number of clues as to what factors outperform and when, and what investors can do to give themselves the best chance to outperform going forward. Is there a connection between outperformance of factor investing and active management? Are correlations the answer to both?
Looking over the past 15 years of factor returns for value, momentum, and size, we see a pretty consistent picture of outperformance, and in some cases quite sizeable outperformance. We’ll call these “alpha factors” as their general design is to outperform indices overtime, typically as stocks rise.
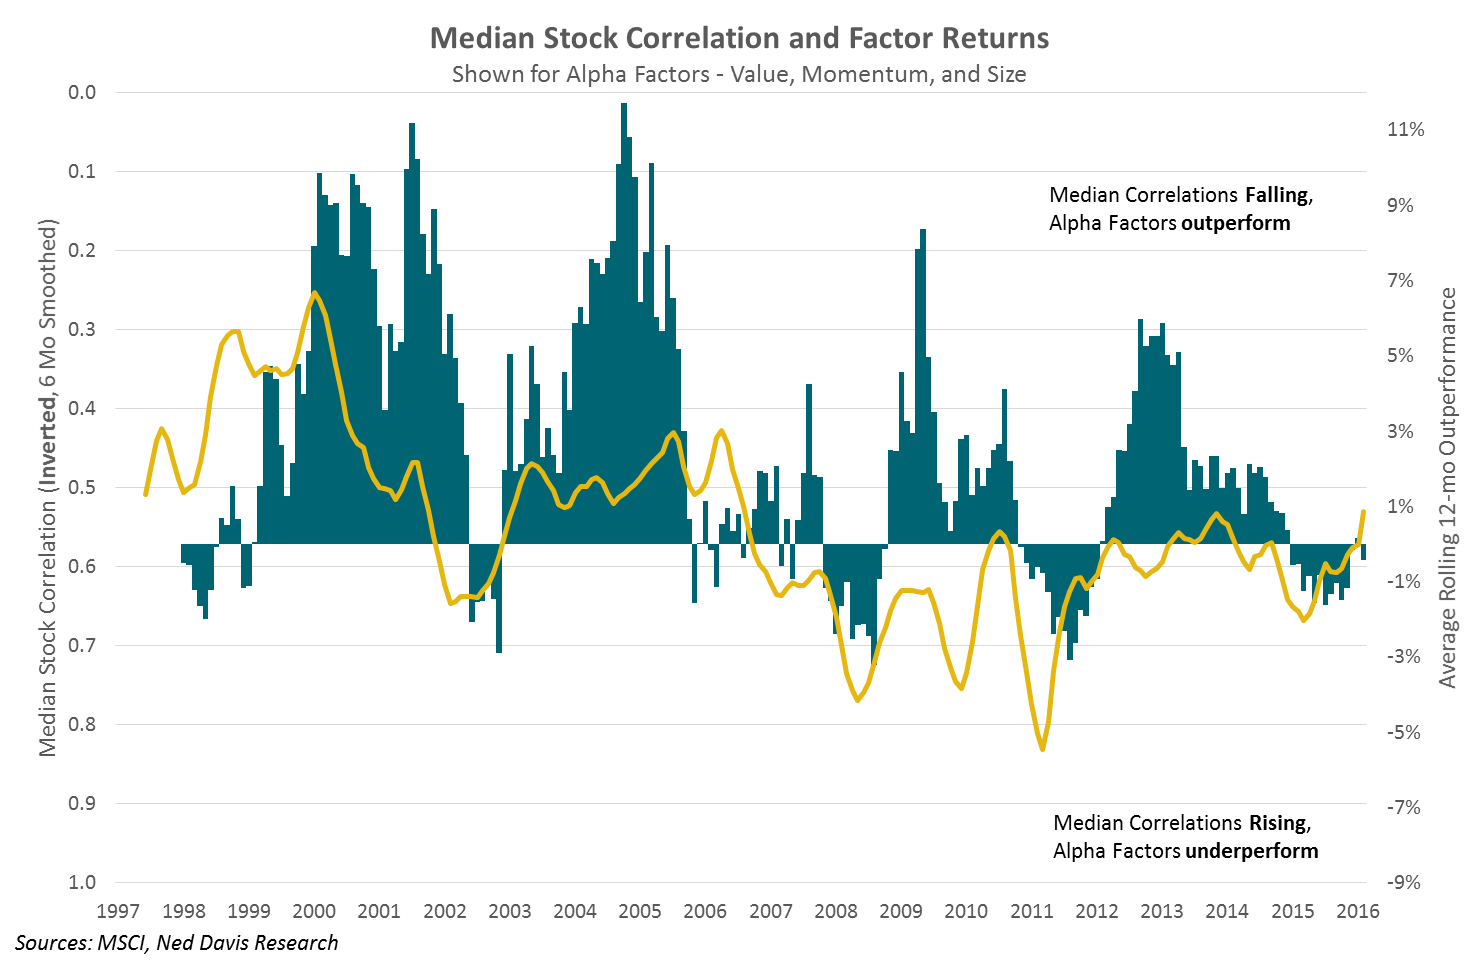
The chart below illustrates this outperformance relative to the parent MSCI USA Index. Overlaid on top is the median intra-stock correlation in the S&P 500 Index, inverted. So as correlations between stocks fall, the security selection that the alpha factors provide leads to outperformance, and vice versa.

© Copyright 2017 Ned David Research, Inc. Further distribution prohibited without prior permission. All Rights Reserved. See NDR Disclaimer at www.ndr.com/copyright.html. For data vendor disclaimers refer to www.ndr.com/vendorinfo/ *12-Month rolling average excess returns (vs MSCI USA) for MSCI USA Enhanced Value, MSCI USA Momentum, and MSCI USA Size Tilt indexes are shown against the 6-month average of median S&P 500 1-day correlations over the past trading quarter.
On the flip side, let’s look at quality and minimum volatility, factors we’ll call “risk factors” for their focus on managing risk and typical outperformance to the downside. The median stock correlation is no longer inverted on this chart, as rising correlations signify outperformance for these factors. Intuitively it makes sense, in periods of market stress correlations “go to 1” and money flows into the seeming safety of the holdings in these factors.

