

By Sean Clark, Clark Capital Chief Investment Officer
Before we get into our 2017 Outlook, let’s look at last year and some of our previous annual predictions (see full Outlook Forecast chart further below).
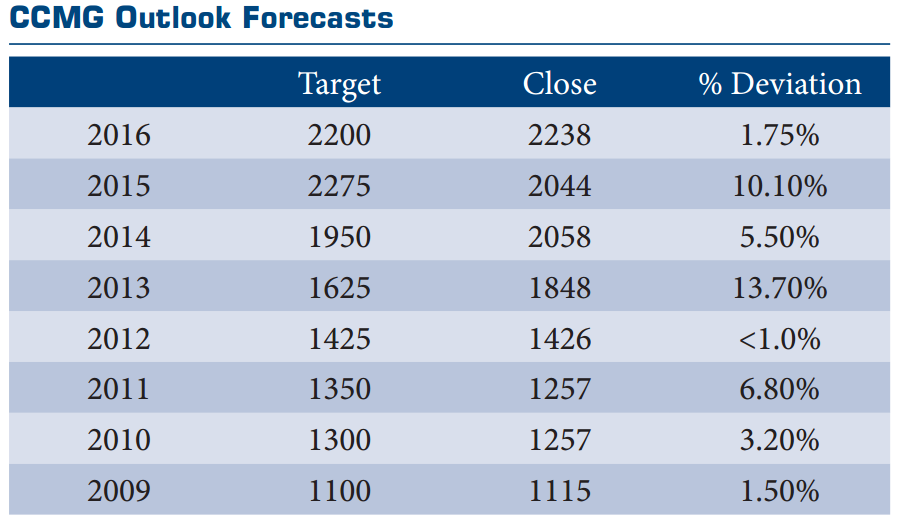
Our forecast for 2016 called for the S&P 500 to end the year at 2200, which would have been a 7% gain for the year. We expected a positive year for the market, and we were more bullish than most given the normal presidential election year trends, the favorable economic backdrop, and the fact that good years normally follow flat years.
As it turned out, our expectation for the market was almost right on target as the S&P 500 closed the year at 2238, very close to our 2200 target. In addition to being fairly accurate with the year end target, we also expected a sharp post-election rally, which was definitely a contrarian view. We put a lot of time and effort in preparing our annual Outlooks.
As you can see from the table further down, we have been fairly accurate in our forecasts since we started making annual predictions. While there were years that our expectations were not realized, we were right on in 2009, 2012, and 2016 and only missed slightly in 2010.
Outlook 2017
Our long-term view is that we are in a secular bull market in stocks. We enter the New Year on solid economic footing and within a long-term secular bull market. We are now almost eight years into the secular bull and seven and a half years into the economic expansion. Nearly every economic indicator we look at suggests continued growth in the U.S. For example, the Conference Board’s Index of Leading Economic Indicators is hitting new highs, consumers are optimistic with Consumer Confidence at a new recovery high, and jobless claims are hitting their lowest levels since the early 1970s.
These all suggest that the economy is set to accelerate in 2017. The positive economic environment is supportive for risk assets. With the economy on solid ground and the earnings recession behind us, we see stocks continuing to advance and expect high single-digit returns for the U.S. stock market in 2017, with a 2400 yearend target for the S&P 500.
The market gains could be frontloaded on expectations of policy initiatives that may not be fully realized, which could result in some volatility in the second half of the year. We continue to favor credit over duration, especially in an environment of rising yields. Historically high yield bonds have done very well in years that interest rates rise given their leverage to the economy. There are risks.
The first year of a new president’s term has historically been weak, and more so when it’s the first year of a Republican in office. In addition, valuations remain stretched, interest rates are set to continue moving higher, and the Federal Reserve seems to be behind the curve with upside risks to inflation.
The latest comments out of the Federal Reserve are somewhat at odds between letting the economy “run hot” and setting expectations of three additional rate hikes in 2017. However, if recent history is any guide, the Fed will fall short of hiking rates as often as they suggest, given that they only raised rates once in each of the past two years.
Economy
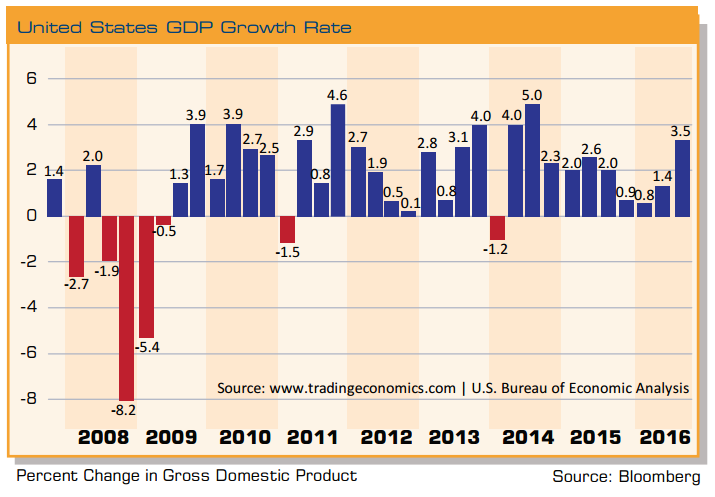
The U.S. economy has expanded for seven and a half years now but only at a 2.1% annualized pace, which is the slowest post-WWII recovery on record. However, over the past several quarters it has been strengthening, and the third quarter 3.5% growth rate was the strongest in two years. It appears the economy is building momentum, and we expect that trend to continue as the new administration’s pro-growth and market-friendly policies should drive GDP higher than the trajectory it has been on.
The consensus of major economists puts economic growth at 2.2%, which is about equal to the growth rate since the end of the recession. That seems way too conservative considering that data has been surprising to the upside recently with GDP tracking above 2.5% over the past six months. Thus, we see more room for upward revisions to the consensus.
We expect the U.S. economy to grow by 3.0% in 2017 as pro-growth policies stimulate spending, tax reform adds to disposable income, and regulatory reform adds to productivity. Consumer confidence has surged in recent months, the labor market is tightening, wage pressures are rising, and economic indicators we look at are on solid footing.
Global growth should outpace U.S. growth and we expect stronger growth across both the developed and emerging economies than we saw in 2016. We expect 3.5% global growth as monetary conditions remain accommodative in the aggregate, and fiscal stimulus should help boost growth. There are plenty of risks to these outlooks, including trade protectionism, a stronger U.S. dollar, higher interest rates, and geopolitical risks in Europe and in the Middle East.
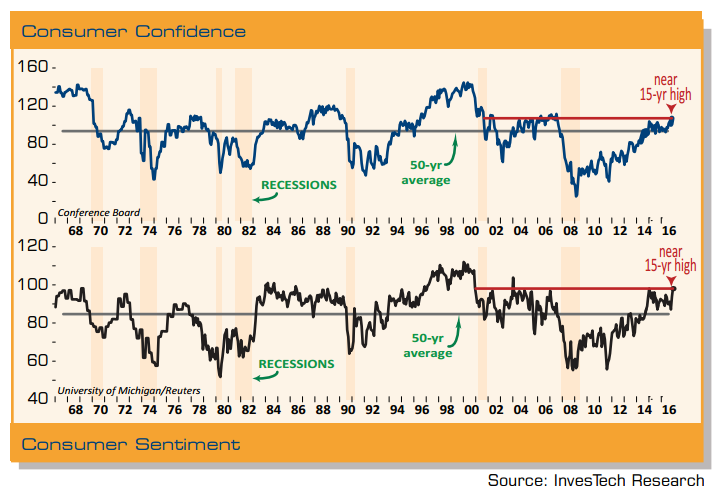
In the U.S., consumers are the most upbeat they have been in 15 years. Consumer Confidence as measured by the Conference Board (top graph) and Consumer Sentiment as measured by the University of Michigan/Reuters (second graph) are both currently near their highest levels since the early 2000s. Where confidence goes consumer spending usually follows – which accounts for roughly two-thirds of U.S. economic activity. Consequently, an upbeat consumer suggests that we have a stable and accelerating economy as we move into the New Year.
The economy is now seven and a half years into its economic expansion. Only three economic expansions in the post-WWII period have lasted longer than the current one. Going all the way back to 1900, the current boom ranks as the fourth longest.
From 1961 through 1969, the economy saw uninterrupted growth for nearly nine years. Then from 1982 through 1990, the economy went just over seven and a half years without a recession. If we don’t see a recession before March, this cycle will surpass that one. The longest boom of them all, though, was from 1991 into 2001 when the expansion lasted a full decade.
We have a high degree of confidence that the U.S. economy has further growth potential. The Conference Board’s Index of Leading Economic Indicators (LEI) has risen to its highest level since early 2006 and is almost out to a new all-time high.
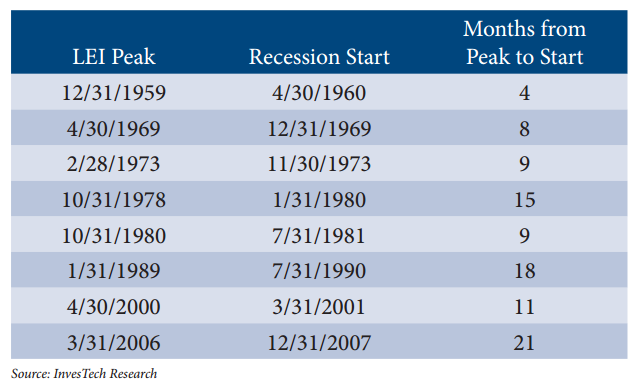
In fact, there have been only five other months in the entire history of this index that have been higher. We put a lot of emphasis on leading indicators because over the past 50 plus years, early weakness in the LEI has preceded every recession in the U.S.
The typical lead time between the peak in the LEI and the start of a recession has ranged between four and 21 months. Since 1960, the average lead time has exceeded 11 months. We are not seeing any weakness currently in the leading indicators index, and if history is any guide, which it usually is, the U.S. economy should continue its expansion through 2017.
In addition to leading indicators, the labor market is also suggesting continued economic expansion. Initial jobless claims are hitting new lows and the four-week moving average of initial jobless claims is not only hitting post-recession lows but also lows not seen since the 1970s. This is important because our research shows that an upturn in jobless claims typically occurs six to 12 months prior to a recession. This is not even on the horizon currently.
The strength of the labor market can also be seen in rising compensation across the board. Wage and price increases may be rising faster than anticipated, and the Fed could easily fall behind in their efforts to keep inflation in check. Average hourly earnings are up 2.4% year over year and the Atlanta Fed’s Wage Tracker, which tracks hourly wages for workers that have been employed full-time for at least a year, shows wages up 3.9% over the past 12 months. In addition, the focus on job creation by President Trump is likely to intensify the wage inflation pressures.
Presidential Election Cycles Now that the election is behind us and a new administration is about to take office, many are asking how the market normally performs under different parties. Does the market do better under a Republican or Democratic president? Well, it depends on the time frame being looked at. The total performance from 1928 until today shows returns being over twice as good under Democratic presidents than under Republican presidents. However, if one is selective in choosing the starting and ending points, one could identify periods where the market does slightly better under Republicans.
For example, the market did great under Presidents Reagan, and Bush 41, and Clinton. Then stumbled when it was in a secular bear market under Bush 43 and then was great again under Obama, who came into office at the time a new secular bull was beginning. So our conclusion is that it likely depends on the environment. Last year marked the twenty-third presidential election since 1928.
Prior to the current political outcome, Republicans have won the White House 10 times and Democrats 12 times. But what happens after the election is over, and does it matter which party wins the presidency? Overall, the likelihood of a stock market gain in the first year after a presidential election has been a little more than 50% (12 out of 22 instances).
While the average gain for these 22 post-election years is a modest 5.2%, strong moves in one direction or the other are frequent occurrences. In fact, 77% of these years saw double-digit changes in the S&P 500 – nine with double-digit gains and eight with double-digit losses. In addition, as is the case now, when a Republican followed a Democrat, the market declined during the first year of the term in all four cases. However, looked at differently, dating back to 1901, the Dow Jones Industrial Average has risen at a 7.03% annualized pace when there has been a Republican president and Republican Congress.
While a recession is not our expectation, early on in a president’s term is usually when they begin. Over the past 88 years, nine of the 14 U.S. economic recessions began in the year following the election. Additionally, three others began during the presidential election year (1948, 1960, and 1980). That would definitely put a damper on market returns this year, but a recession in 2017 is not our expectation.
In fact, as noted earlier, we expect the economy to accelerate given pro-growth policies of the new administration, tax reform, regulation reform, and a strengthening global economy. U.S. Equity Market The Ned Davis Research Cycle Composite is a combination of the market’s historical one-, four-, and ten-year cycles combined into a single composite.
It is a tool we use that helps provide a framework for or possible roadmap of how the market may trade in the coming year. In the past it has served us well in formulating our Outlooks and the market tracked the cycle composite very closely last year.
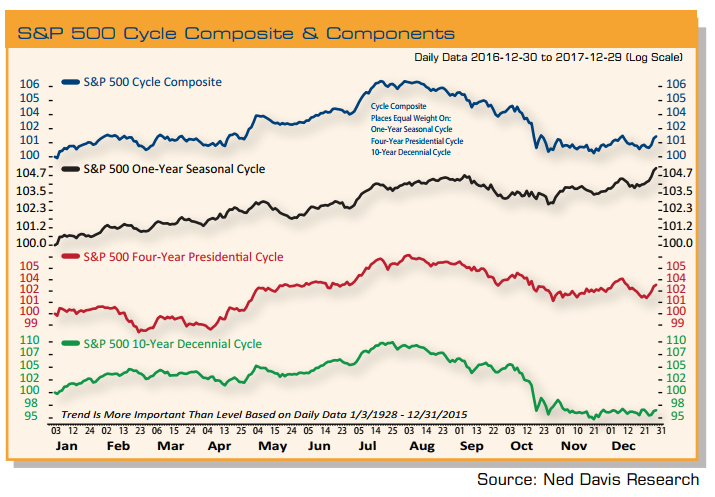
The top clip in this chart is the cycle composite for 2017. The other three clips are the components of the composite, the one-, four-, and ten-year cycles. The cycle composite suggests a mostly positive trend during the first half of the year, but then reverses early in the third quarter due primarily to the decennial cycle. Postelection years have also tended to be weak in the second half. Part of the reason is that government stimulus tends to decline after the election.
A big fiscal stimulus plan, which is being talked about by President-elect Trump, would contradict that tendency. In addition, the market gains could be front loaded on expectations of policy initiatives that may not be fully realized, which could result in some volatility in the second half of the year.
In last year’s Outlook, we discussed the historic tendencies of how the market traded in election years and noted the trading range that it had been in since peaking in May 2015, which ultimately continued throughout the first half of 2016.
Historically election years are typically weaker in the first half and then rally strongly in the second half of the year. History proved to be a good guide as that certainly was the pattern last year. The market broke to the upside in early July after the Brexit vote, but it wasn’t until after the presidential election that the market really advanced sharply.
This chart shows the S&P 500 during the current bull market and highlights in red those periods of consolidation of 100 or more trading days without hitting a closing high. While it’s normal for stocks to consolidate, the 285 trading day period that spanned May 2015 into July of 2016 was the longest consolidation period of the current bull market by nearly eighty trading days.
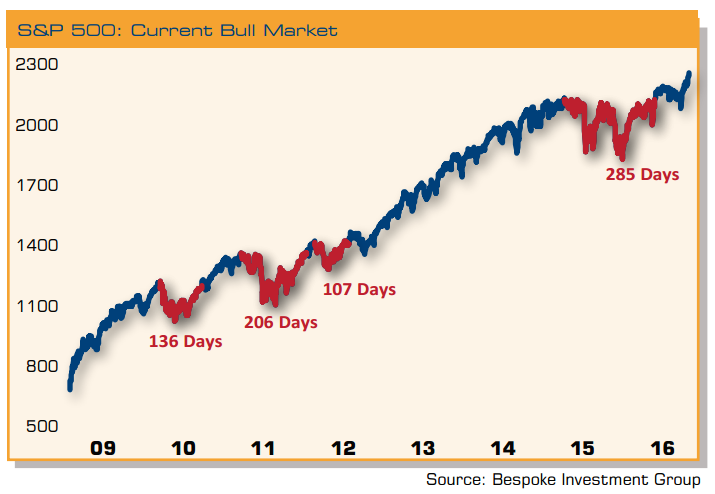
Establishing a new high for the S&P 500 is a rare occurrence following a pause of 300 or more calendar days. According to analysis from Merrill Lynch this has happened only 23 times since 1929 and the resulting advances have been very strong. The S&P 500 has gained an average of 15.6% during the year following such an extended pause and has been higher 91% of the time.