By Corey Hoffstein and Justin Sibears, Newfound Research
Trend GDP growth is a critical determinant of traditional asset class returns. For equities, GDP growth has historically served as an upper bound to earnings growth. For bonds, short-term interest rates can be modeled as the sum of GDP growth, time preferences (i.e. the relative preference between saving and investment), and monetary policy effects.
When thinking about GDP growth, we prefer to follow an unbundle/re-build framework. With this approach, we unbundle the sources of GDP growth, analyzing each both individually and in concert with the other sources of growth, and only then re-aggregate the components to top level GDP growth.
There are a number of valid methodologies for decomposing GDP growth. In this piece, we will use a supply-side approach. The basics are as follows.
In the equation below, let Y denote real GDP and N denote total population. We can decompose real GDP per capita as follows:
where E is total employment and L is the working age population.
The first term on the right-hand side of the equation (Y/E) reflects the amount of output generated per worker. This is a measure of productivity.
The second term (E/L) is the proportion of the working age population that is employed. This will be a function of the labor force participation rate and the employment rate (one minus the unemployment rate).
The third term (L/N) is the percentage of the population that is of working age (16 years and older).
Once we understand the sources of per capita GDP (Y / N) growth, we can easily pivot to total GDP (Y) growth since total GDP growth will be approximately equal to the sum of per capita GDP growth and population growth.
A Case Study: Understanding Long-Term GDP Growth in the United States (1948 to 2015)
As a case study, let’s unbundle the sources of U.S. GDP growth from 1948 to 2015. In 1948, real GDP was $2.0 trillion in 2009 dollars. By 2015, real GDP had growth to $16.4 trillion, an annualized growth rate of 3.2%.
Of this 3.2% growth, a little less than two-thirds (2.0%) resulted from more output per person (i.e. growth in real per capita GDP). The remaining growth (1.2%) came simply from an increase in population.
We can go a step further by decomposing per capita GDP growth down to changes in productivity (output per worker), changes in the employment rate (the percentage of the working age population that is employed), and changes in population composition (the percentage of the population that is of working age).
The vast majority (~89%) of per capita GDP growth can be attributed to increases in productivity. Changes in the employment rate and population composition combined to contribute just 0.23% to real per capita GDP growth.
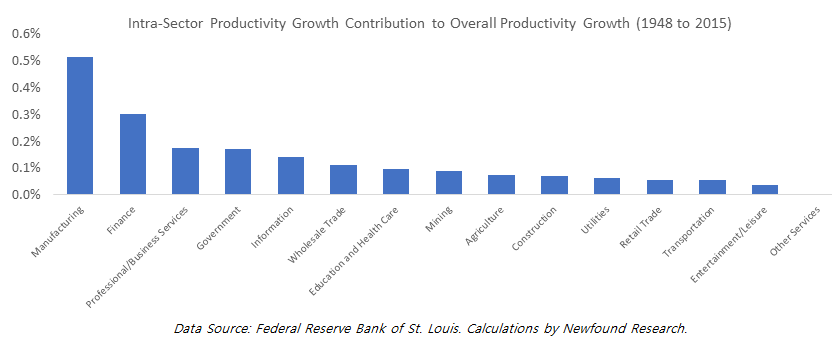
To gain more intuition around the drivers of productivity growth, we can break it into two components:
- Intra-sector productivity growth (e.g. farmers producing more output per worker).
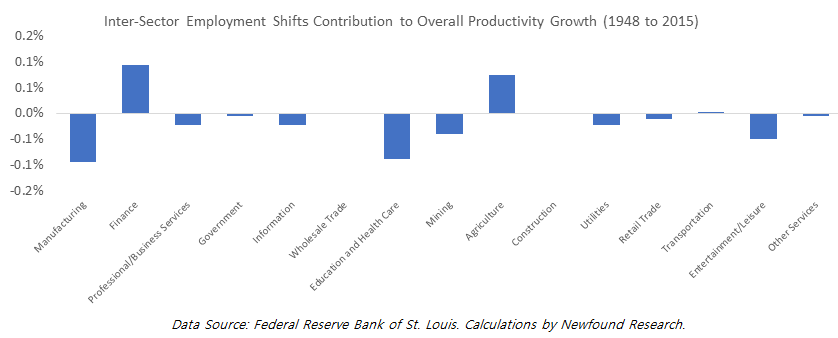
- Inter-sector employment shifts (e.g. workers moving from the farming sector to the manufacturing sector). If workers move from less productive sectors to more productive sectors, economy-wide productivity will increase. If workers move from more productive sectors to less productive sectors, economy-wide productivity will decline.
Decomposing Real GDP (1948 to 2015)
Productivity growth over the 1948 to 2015 period can be entirely attributed to intra-sector productivity growth. More than half of the productivity gains came from just three sectors: manufacturing, finance, and professional and business services (which includes many tech businesses).
Inter-sector employment shifts were actually a modest detractor from productivity growth as workers on average moved from more productive to less productive industries.
Shortening the Time Horizon
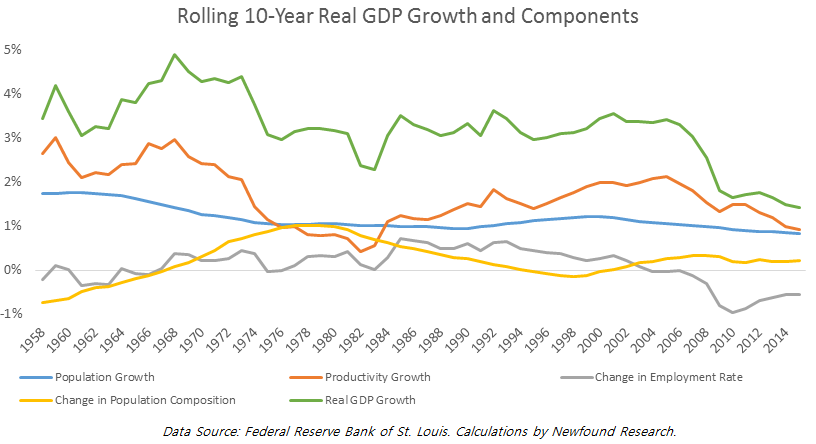
It can also be informative to narrow our time horizon and consider shorter rolling periods. Below, we plot rolling 10-year GDP growth as well as the contribution of each of the main components discussed above.
From the graph, it’s clear that real GDP growth has been slowing, especially over the last decade. From 1958 to 2007, the U.S. economy grew at 3%+ in 95% of rolling ten-year periods.
The economy has not returned to this growth rate since.
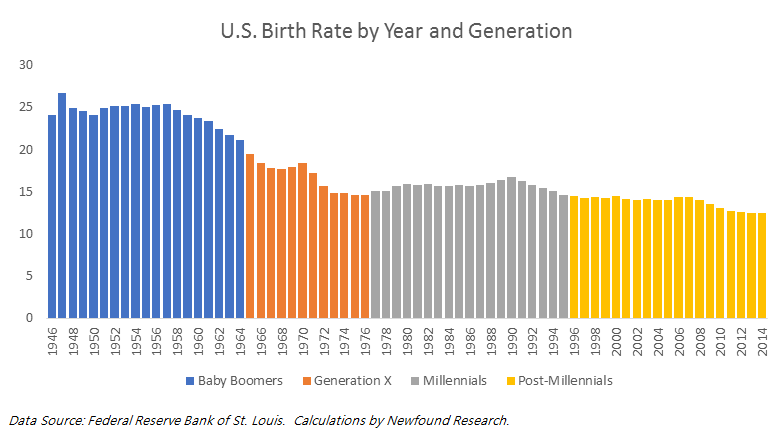
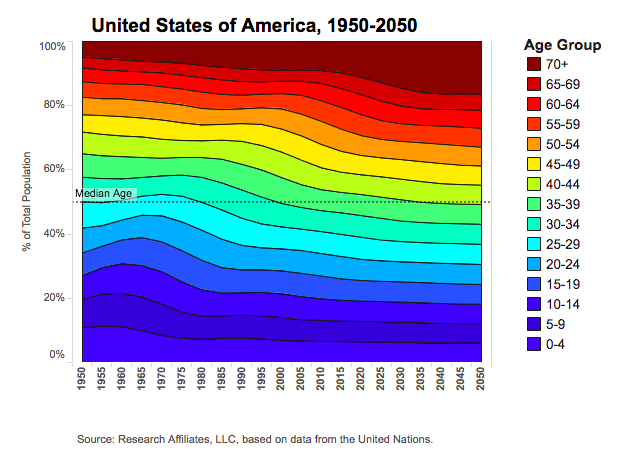
This decline been caused by both slowing productivity growth and unfavorable demographic developments. From a demographic perspective, two trends have combined to form a strong headwind for growth:
Slowing overall population growth due to declining birth rates after the Baby Boomers.
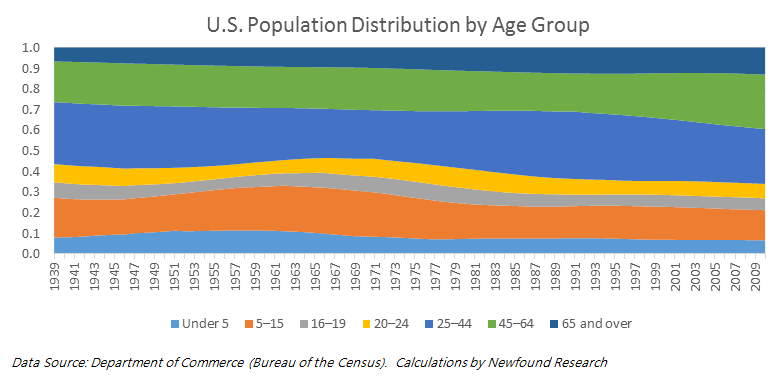
2. Aging of the population, leading to a decline in the employment rate – defined here as the percentage of the working age population that is employed. From 1940 to 2010, the percentage of the population over 65 years of age nearly doubled from 6.8% to 13.1%.
Looking Forward
We can use the unbundle/re-bundle approach not only to understand the past, but also to form views on future GDP growth.
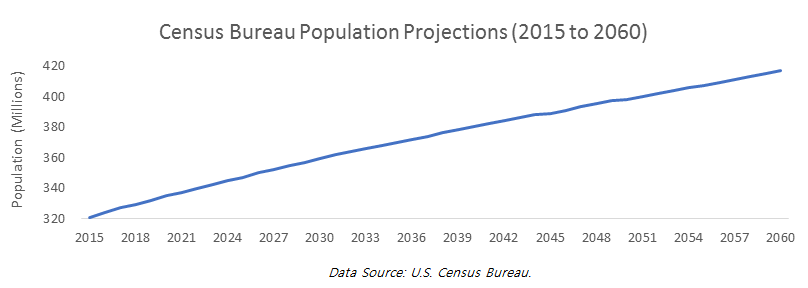
The Census Bureau publishes population and demographic projections out to 2060. They currently project that the overall population will increase from 321 million in 2015 to 417 million in 2060, an annualized growth rate of 0.58%.
We can use these same projections to estimate that 82% of the population will be of working age (16+) in 2016. This is an increase from 78% in 2015. If realized, this workforce expansion would contribute +0.13% to annual real GDP growth.
Unfortunately, this benefit is wiped away by the projected aging of the population. Assuming that unemployment settles at 4.8% (the current long-term natural rate as calculated by the Federal Reserve), we project that the employment rate (workers divided by number of people of working age) will decline from 59% in 2015 to 54% in 2060. In calculating this projection, we make the simplifying assumption that age group labor force participation rates remain constant. This shift would be a 0.21% drag on annual real GDP growth.
The final component that needs to be forecast is productivity growth. In our view, this is the most difficult component to forecast. Fortunately, a precise estimate is not needed to draw meaningful directional conclusions.
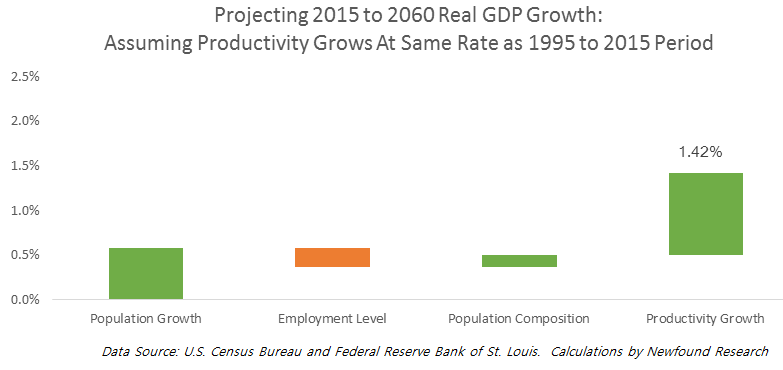
Combining the impacts of the simple forecasts of population growth (+0.58%), employment level (-0.21%), and population composition (+0.13%), we estimate just 0.49% of real GDP growth from expansions in the size of the workforce.
With these estimates, any GDP growth above this 0.49% will have come from productivity growth.
This implies that for the U.S. economy to match the growth it saw from 1948 to 2015 (3.17%), productivity would have to grow by 2.68% per year.
To put this into perspective, productivity grew this rapidly in less than 7% of the rolling ten-year periods we studied. The last time the economy achieved this feat over ten years was for the period that ended in 1968.
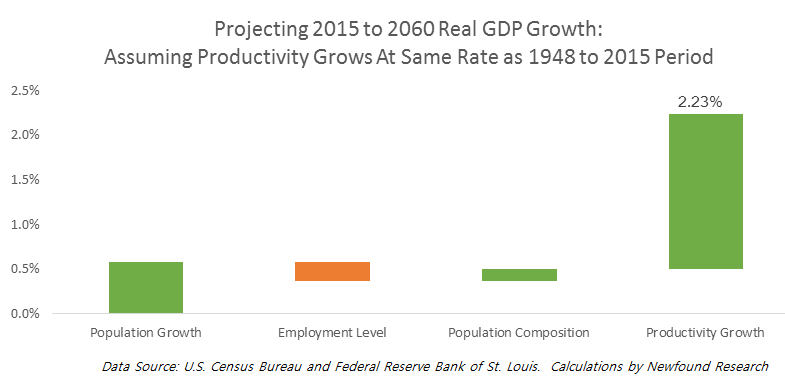
More realistically, we could assume that productivity growth matches the long-term average from the period we studied (despite, arguably, being a highly anomalous period due to major technological and economic innovations like the computer, the jet engine, and globalization).
From 1948 to 2015, productivity growth contributed 1.74% to annualized real GDP growth. If the U.S. matched this accomplishment from 2015 to 2060, projected real GDP growth would be 2.23% per year.
That is a 30% discount to the long-term average.
Alternatively, we could assume that productivity grows at the pace we’ve seen more recently. Over the last ten years, productivity growth contributed 0.93% to annualized real GDP growth. If the U.S. achieved this lower hurdle from 2015 to 2060, projected real GDP growth would be drop to just 1.42% per year, less than half of the economic growth we are accustomed to.
Which of these scenarios is more realistic? The truth is that nobody knows. If we had to guess, we’d lean towards the more pessimistic scenario.
One main reason for this is that productivity and demographics are not independent variables. Rob Arnott and Denis Chaves published an interesting piece on this topic (“A New ‘New Normal’ in Demography and Economic Growth”). Quoting from the paper:
“Our results show that children have a slightly negative effect on economic growth, but young adults start to positively contribute as they join the work force. Skeptics might argue that wages and productivity peak later in life, typically in one’s 40s and 50s. This is generally true, and helps to explain why the most prosperous nations often have a larger proportion of mature adults than the less prosperous nations. However, the definition of a peak, whether for productivity or anything else, is that we stop rising and start falling. When we reach peak productivity, our growth in our productivity is zero! It’s the young adults, in their 20s and 30s, who have the most rapid rate of change in their productivity. One might say that mature adults are terrific for GDP, but not for GDP growth, and that young adults are terrific for GDP growth, but less so for GDP.
The average contribution to GDP growth becomes negative between 55 and 60. Again, this does not mean that people begin to consume more GDP than they produce after age 55, only that—on average—mature workers above age 55 have passed their peak in productivity. One can readily infer from this graph that the average 60-yearold is more productive than the average 40-year-old, but not so relative to the average 55-year-old. At ages 60 and above, the coefficients decline much more sharply: The mature worker exhibits falling productivity, but in retiring, a worker’s productivity simply falls off a cliff!”
Conclusion
Trend GDP growth is a critical determinant of traditional asset class returns. For equities, GDP growth has historically served as an upper bound to earnings growth. For bonds, short-term interest rates can be modeled as the sum of GDP growth, time preferences (i.e. the relative preference between saving and investment), and monetary policy effects.
When thinking about GDP growth, we prefer to follow an unbundle/re-bundle framework. We can use this approach to both understand historical and project future economic growth. Historically, approximately 55% of growth has come from productivity growth and 45% has come from demographic changes. More than half of productivity growth came from three sectors: manufacturing, finance, and business and professional services (which includes many tech businesses).
Going forward, we expect demographics to contribute about 0.5% to annual GDP growth. As a result, future growth is likely to lag past growth even if productivity growth accelerates out of its current lull and back to the historical average.