
By John Lunt, President of Lunt Capital Management, Inc.
One of the themes of 2016 has been the continued growth of smart beta ETFs, including the proliferation of factor-based ETFs. There are now a wide variety of factors accessible to investors, including low volatility, quality, dividends, value, momentum, and high beta. ETFs exist across the spectrum of market capitalization and for both U.S. and International markets.
The adoption of factor strategies has followed volumes of academic and industry research on the efficacy of factors. There is no shortage of white papers demonstrating the long-term outperformance of individual factors over the market cap-weighted benchmark. There are sound arguments for the sustainability of factor premiums into the future.
In September, I spoke on a panel at the Morningstar ETF Conference titled, “Getting Active with Factors.” After the conference one of my fellow panelists, Anthony Davidow from Charles Schwab, sent me a table showing the annual returns of various factors over the past decade. I have created a similar table below for U.S. Large Cap Equities using factor indices:
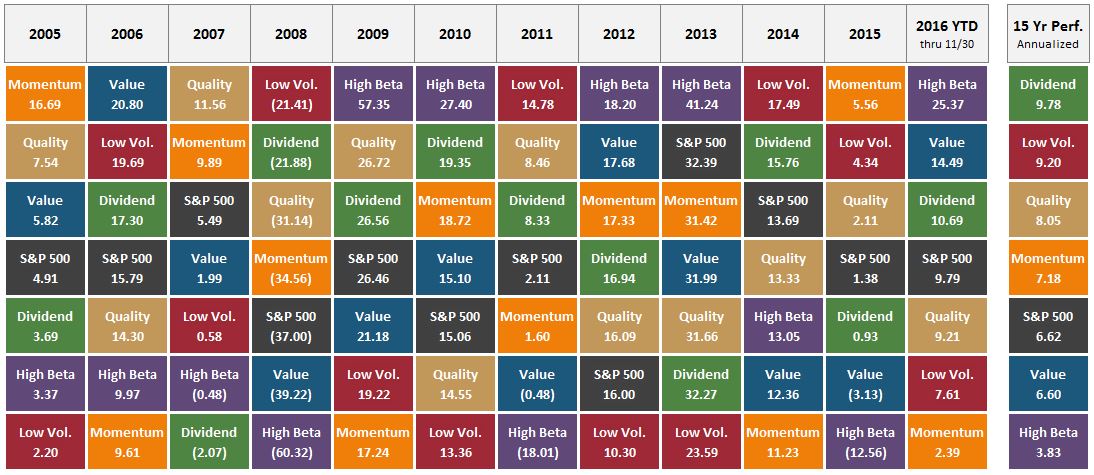
Data from Morningstar. Indices used include S&P 500 Momentum TR USD, S&P 500 Low Volatility TR USD, S&P 500 TR USD, S&P 500 High Beta TR USD, S&P 500 Dividend Aristocrats TR USD, S&P 500 Value TR USD, and Russell 1000 Quality Factor TR USD. You cannot invest directly in an index.
This table reveals two key points for this period: 1) Some factors (Dividends, Low Volatility, Quality, and Momentum) have each generated strong long-term performance relative to the market cap-weighted benchmark. 2) Each factor has had periods or “seasons” of underperformance and outperformance relative to the benchmark. As always, past performance does not guarantee future returns.
Low volatility has been the poster child of smart beta or factor-based strategies. Billions of dollars flowed into low or minimum volatility strategies during the first half of 2016. The table above shows that the low volatility index outperformed the market cap index (S&P 500) over the past 15 years. It also shows seasons of meaningful low volatility underperformance and outperformance. The period of 2014 through the end of Q2 2016 was a season of outperformance for low volatility. This helped investors forget the low volatility factor underperformed the S&P 500 in 2009, 2010, 2012, and 2013. In fact, it was the poorest performing factor during three of those years. During the first half of 2016, the low volatility factor was the star, up 12.32% while the S&P 500 was up 3.84%. From July 1 to November 30, the low volatility factor was a villain, down 4.19% while the S&P 500 was up 5.73%.