
Turn the frown upside down! Options on the SPDR Gold Trust ETF (GLD) can exhibit a different type of skew structure than what other types of products display and this can lead to incremental returns to a portfolio incorporating “income” producing strategies. One strategy that can profit from elevated volatility in a skew neutral fashion is the short strangle.
A basic option pricing model assumes that volatility is a known constant. Volatility is a random variable that is a function of underlying price movements and is neither known ahead of time nor is constant. Before the advent of computers and “modern” option pricing theory, it was quite common for traders to use a constant volatility across strikes.
Essentially, traders assigned the same supply and demand factors to downside options (strikes less than the current ETF price) as they did for upside options (strikes greater than the current ETF price). In certain products, such as the SPDR S&P 500 ETF (SPY), there is a constant demand to hedge and protect long equity exposure from adverse market moves. We can refer to options on equities, because of the incessant demand for protection and the ability for a company to simply issue more equity or debt to raise capital, as supply side products.
A volatility skew, in equity and fixed-income products will be negatively sloping. Out of the money puts trade at higher volatilities than out of the money calls. Option prices are based on probability. Models are essentially giving more value, or a higher likelihood of an event happening, to downside puts.
Whether that “event” comes to fruition or not, is another story. Below is a graph of SPY options represented as a percentage (%) of moneyness. For example, the at the money option is identified as the 100% strike.
Supply-Side (Reverse) Volatility Skew
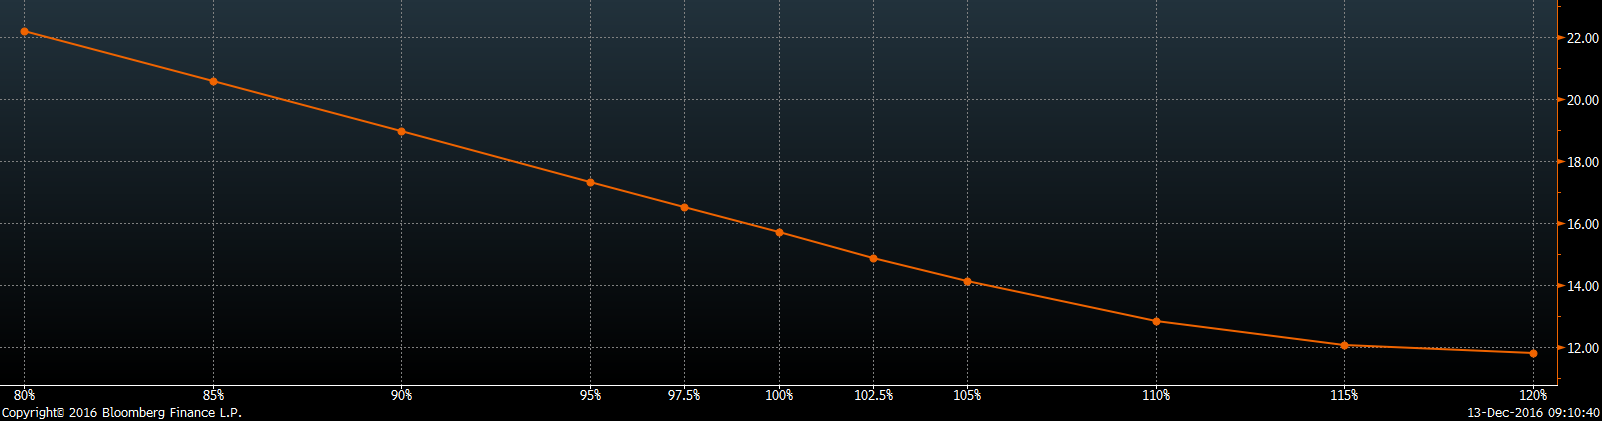
(Click to enlarge) Source: Bloomberg
Try to remember the bell curve, or the normal distribution from statistics. Or, you may want to simply picture a “pie”. The curve is telling the model to shift to the left to give more value to out of the money puts (higher probability of outcome). The bell curve is just like one whole pie. We have not cut any pieces away from the pie, we just shifted it to the left. When we do this, we are taking away value from the right side, or in our case the out of the money calls (less probability of outcome).
Commodities, on the other hand, are demand side products. There is only a fixed amount of corn, oil, etc. and these skews will be positively sloping. Unlike stock, fear is to the upside for commodities, in other words, rising prices. With commodities, we shift our pie to the right (out of the money calls) and thus take away value from the left (out of the money puts).
Demand-Side (Forward) Volatility Skew
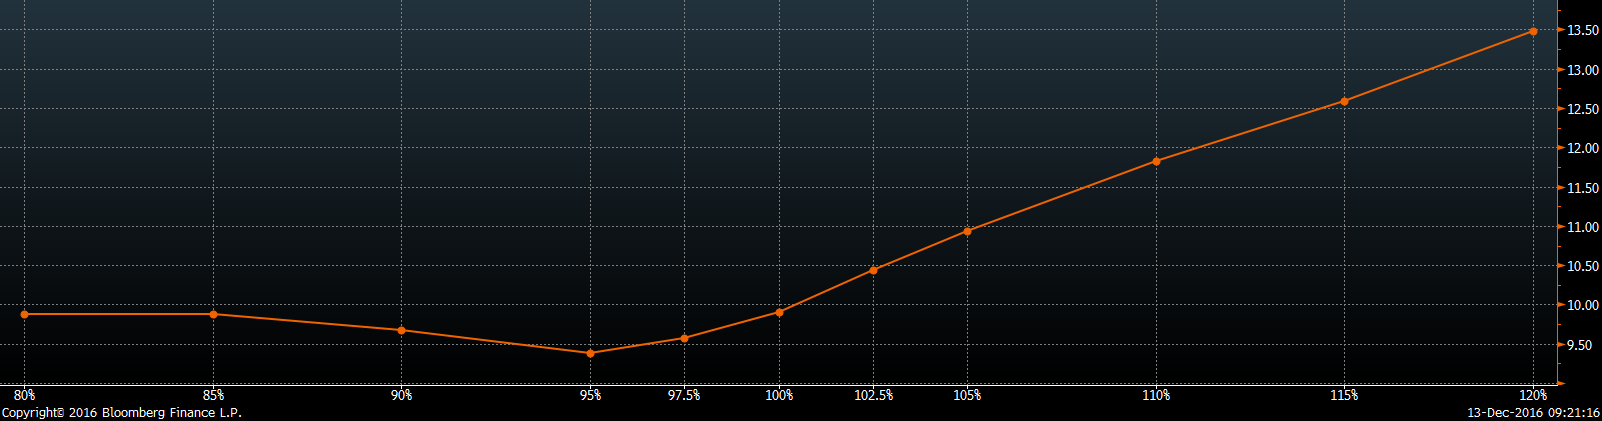
(Click to enlarge) Source: Bloomberg
Volatility skews can also be referred to as smiles or smirks. One of the features of options on the ETF GLD, is neither the presence of a supply-side nor a demand-side skew. Yes, gold is a commodity, but many treat the precious metal as a hedge to equity as well. Thus, GLD options manifest the third type of volatility distribution, better known as the smile.