

The Bull market of today began seven years and seven months ago and, according to one way of measurement, is the second longest since 1929.
A popular saying is that “a bull market must climb a wall of worry.” There have been many walls of worry since March of 2009 when this Bull was born. Among those worries have been the fiscal cliff, new normal, QE, ZIRP, Grexit, Arab Spring, ISIS, and most recently Brexit and the problems with Deutsche Bank.
All of the above can cause fear, anxiety, and uncertainty, which can result in investors shying away from putting their cash to work in equities. Once a secular Bull begins to grow, it takes a lot of negativity and/or economic disaster to derail it. One of the ways we measure market potential is by using investor sentiment. When sentiment indicates investors are overconfident, history has shown us that it most likely means that a decline is ahead. Conversely, when sentiment is negative, as it is today, the possibility for an extension of the uptrend is present.
One way to determine when a Bull market is over is to say that when a 20% or more correction, over a certain time frame, occurs in an uptrend, the Bull market has ended and a Bear market has begun. Using this measurement, there have been, including the current one, sixteen Bull markets since 1929, each interspersed with Bear markets.
In the early 1990s, Ned Davis Research developed criteria for further defining shorter term Bull and Bear trends as cyclical. And following the stock market bubble of 2000, Ned Davis further refined trends to describe longer term, or secular trends, that would include many shorter term or cyclical trends. The chart below was shown in the previous Navigator Report but I believe it should be shown again.
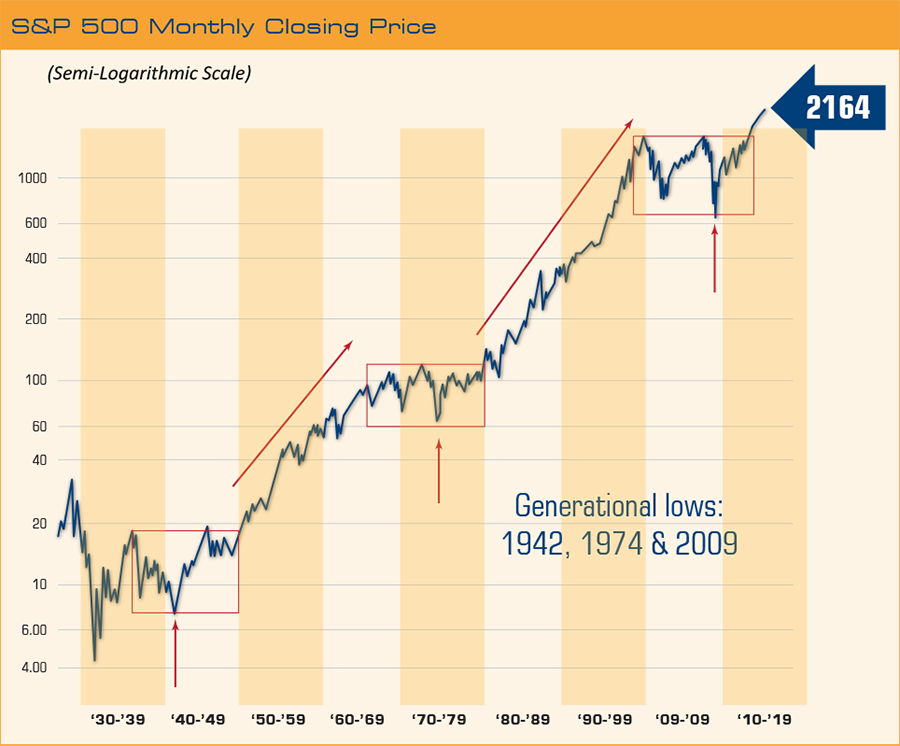
I show this again because we believe the single most important influence on long term stock market performance is identification of a secular Bull market.
Longevity is the key to success when a secular Bull is born. The first one shown lasted from 1942 to 1966, or 24 years. The next, 1982 to 2000 lasted 18 years. The current secular Bull is only 7.6 years old and could last for many, many more years.
Does this mean that we can forget about serious downdrafts if we are in a secular Bull market? No, not quite, but close! During the three secular Bulls shown above, which totaled 49.6 years, there were a total of only seven cyclical Bear markets. The sum total of all seven cyclical Bears is 4.05 years as the median time in a downtrend was 211 days. That means that over almost five decades of advancing markets, less than one half of a decade was spent in declining cyclical Bear markets. The biggest decline was 36.1% in the 1987 crash (but the recovery was very quick and that year closed with a gain of 5.1% on the S&P 500). The smallest was 14.5% which ended on February 11, 2016. That decline began in May of 2015 and lasted 268 days. The combination of decline and time qualified it as a cyclical Bear in that time frame. In addition, many other indices had declined well over 20%. This is a very important fact because it means that on that date, February 11, 2016, a new cyclical Bull market was born.
As stated above, identifying a secular uptrend and staying with it is arguably the most important aspect to successful investing. Identifying secular downtrends is also important as over the last seventy-four years (since 1942), twenty-five years have been spent in secular downtrends. This will be discussed in a future Navigator Report, but for now, we are concerned with the longevity of the current secular Bull market and the new cyclical Bull that began in February.
What can we expect from this new cyclical Bull? According to Ned Davis Research, there have been 18 cyclical Bulls within secular Bulls and the mean cyclical Bull has lasted 1027 days and produces a gain of 107%. He also states, “If the market continues to perform in line with past secular Bulls, then a double-digit annualized return is a conservative estimate for the next two years.”
Another positive sign, again from Ned Davis Research, that the current Bull could still produce nice returns is that since 1942, whenever there was a weak year on the S&P 500 (5% gain or less), the following year produced a median gain of 26.8%. This has occurred ten times since 1942 and the return was positive the following year in all cases. The weak year’s worst decline was -10.9% in 1957 and the best was +5% in 1948. The years following those were 1958, which gained 43.4%, and 1949, which gained 17.8%. The situation that seems to be most similar to today’s was in 1994 when the S&P 500 returned 1.2% and in 1995 when the return was 37.4%. We are not expecting that kind of return but, in all cases, the year following was positive.
Economic Expansion
The following chart, from Jim Stack’s InvesTech, shows all the economic expansion since 1900. As you can see, there have been 21 expansions with an average life of 3.8 years. The current expansion is 7.3 years old and is now the fourth longest since 1900.
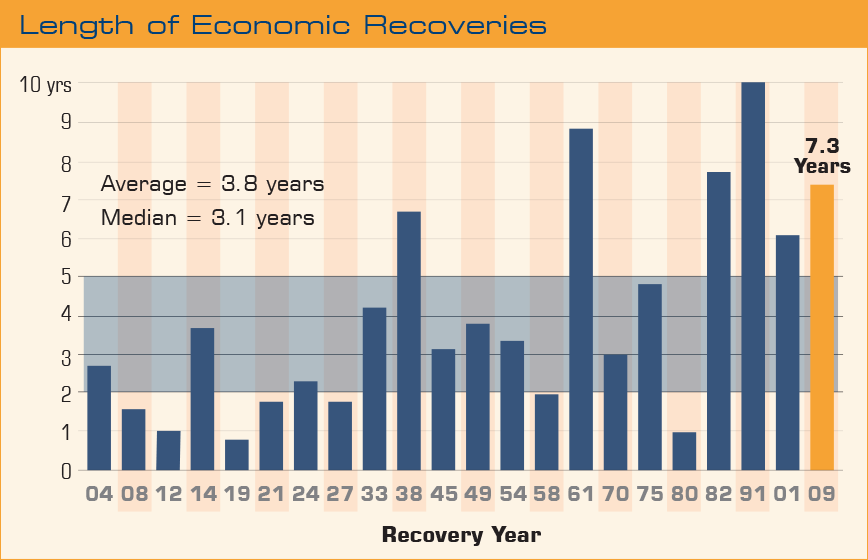
The question is: what will cause the current expansion to come to an end? Several things could happen, such as the economy severely overheating, leading economic indicators taking a nose dive, and Fed (U.S. Federal Reserve) policy becoming overly restrictive.
The current recovery from the recession of 2008-09 has been the weakest on record with the past several quarters being rather anemic. While the economy is expected to pick up some steam, I do not see how it could get overheated anytime soon.
Leading economic indicators (LEI), as shown, are still expanding. The average lead time from when this indicator peaks and begins to decline to the start of a recession has been twelve months. The shortest time, four months, was when the LEI peaked on December 31, 1959 and the recession began on April 30, 1960. The longest lead time was when the LEI peaked on March 31, 2006 and the recession began 21 months later on December 31, 2007.
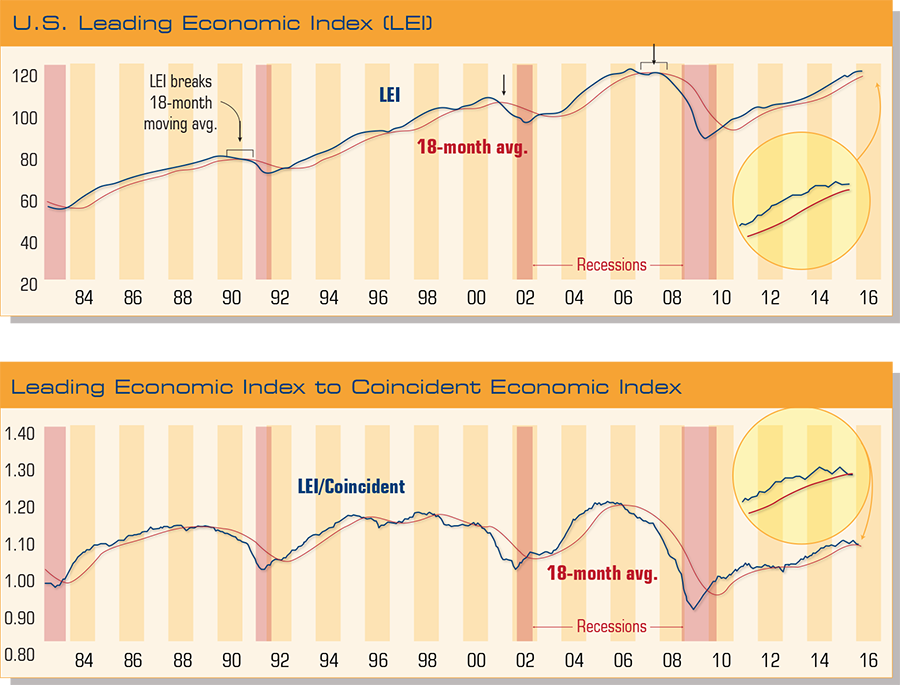
So, at this moment, this does not seem to be a deterrent to further expansion.
Fed action has almost always been associated with economic downturns. There have been 18 economic declines since the Fed was formed in 1913. And I believe that almost all declines have been precipitated by Fed action. The current situation is that the Fed has recently begun a tightening cycle after ten years of keeping rates unrealistically low. It seems almost certain that the Fed will raise rates in December, and it has publically stated that they intend to raise rates twice in 2017. So, outside of some extraneous event, I believe the single largest risk to the economy and the market is a mistake by the Fed.
Election Uncertainty
Presidential election times are always uncertain and always cause stress in the marketplace. But over the past 17 elections following WWII, the median gain in the election year has been 10.4%. So far the market has followed the roadmap pretty well as the current market went flat in May of 2015 into mid-2016. Most strength comes later in the year and continues right through the election period.
Normal election years see a rally into November, a President is elected, a pullback then occurs as some sell on the news, and then we enter the holiday season and everyone seems happy again. Going into the New Year, pensions have been funded, money flows into the stock market and the rally that began in November continues into April.
Yes, Donald Trump is the new kid on the block and this is causing some concern and uncertainty. The way the market is acting seems to say that it believes a Democrat will retain the White House. Sort of like the Devil you know is better that the Devil you don’t.
Things That Matter
Things that matter, in terms of the current Bull’s longevity, include the engine that drives the market, corporate earnings; consumer sentiment, because 70% of our GDP (Gross Domestic Product) is driven by consumer spending; and other more technical aspects of the market.
According to Thompson Reuters, corporate earnings of the S&P 500 companies are estimated to have declined by only 0.5% in the past quarter. If this estimate is low by only a small amount, it might mean the end of a four-quarter earnings slump. As you can see from the graph, corporate earnings peaked in the third quarter of 2014 and declined for six quarters to the low in the first quarter 2016. This decline is due almost entirely to the drop in earnings of the energy sector as oil plummeted to a 12-year low early this year. Without energy earnings, corporate profits would have been up 2.9% for the past quarter. Corporate revenues are expected to have increased 2.6% in the quarter stemming a six-quarter slide.