A client-friendly version of this article can be downloaded here.
By Gary Stringer, Kim Escue and Chad Keller, Stringer Asset Management
While the press and many investors are focused on the upcoming U.S. election, we remain focused on the fundamentals of the global economy. There will be headlines around the election and volatility in the markets, however, economic fundamentals are really the drivers of investment results over time.
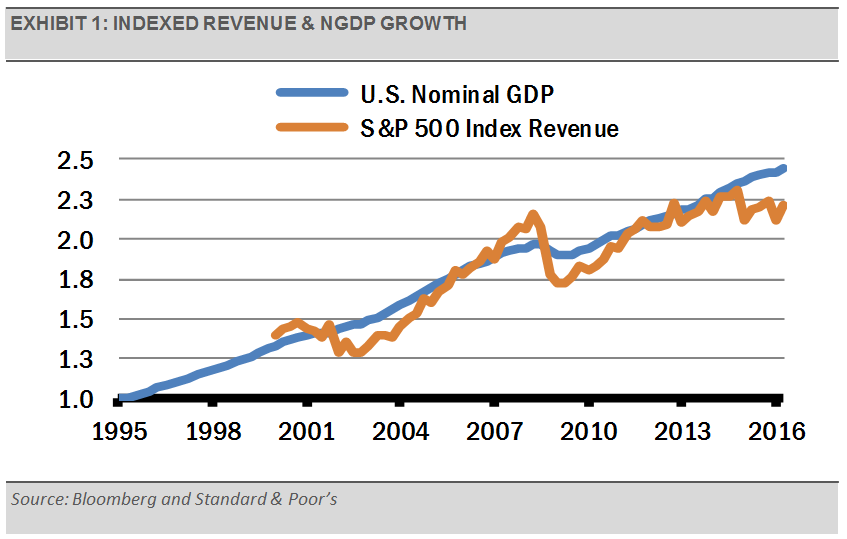
Earnings growth advances stock prices forward, and earnings are heavily dependent on revenue. Revenue growth, in turn, is closely related to the nominal growth in economic activity as the following graph demonstrates. When thinking about economic and stock market fundamentals, it is important to think about what leads to NGDP growth.
Nominal GDP (NGDP) is real GDP plus inflation. We care more about nominal GDP because revenues and earnings growth include inflation. In generating its long-term forecast for real GDP (not including inflation), the Bureau of Labor Statistics (BLS) combines a forecast for labor market growth and productivity growth. Labor market growth is based on demographic trends, which move slowly and are relatively easy to measure. Productivity is more difficult to forecast because it is based largely on new technologies and innovation. The BLS forecasts annual growth of roughly 0.5% for the labor force, and approximately 1.8% for productivity growth, for a 2.2% real GDP forecast.
To create a forecast for NGDP, we include an inflation factor using market-based inflation expectations as a proxy for what to expect going forward. We like to use the relationship between Treasury bonds and Treasury Inflation Protected Securities (TIPS) of the same maturity, known as the TIPS breakeven spread, to derive what the market thinks inflation will be over the next several years.
The market expects inflation of roughly 1.5% over the next ten years. As a result, we think that 3.7% (2.2% + 1.5%) is a good estimate for NGDP on average over the next several years.
None of the inputs to economic growth (labor force and productivity growth rates, along with inflation), corporate revenues, and earnings are directly and significantly impacted by a presidential administration. Granted, an administration may have significant influence on specific industries through various policy measures (e.g. regulations or subsidies), but, in aggregate, what drives the U.S. economy is the stable growth rate of our labor force and the productivity of our private sector. It is these factors that should be the area of focus for broad equity market investors.
While we largely think politicians are not influential in the long-term trajectory of our economy, we do think that the Fed plays a key role in the U.S. economy and is typically a positive force through counter-cyclical monetary policy and the ability to be the lender of last resort. The Fed’s Federal Open Market Committee (FOMC) has proved to be a strong influence over the economy and, indirectly, U.S. equity market performance. Recessions of some magnitude occur about every seven years on average and are generally associated with Fed tightening cycles. Out of the 18 economic downturns since the founding of the Fed, most have been associated with large equity market selloffs of 20% or more. Herein lies the real risk for investors, in our opinion.
In the current environment of sluggish economic growth with little inflationary pressure, we think that the Fed should move very cautiously on raising short-term rates. If the current economic trends continue and the Fed waits, the larger the economy will be, the more people will be employed, the more income and savings the country will have, and the better off we will be.
There are multiple levers the Fed uses to influence monetary conditions, with the primary lever being short-term interest rates.
The natural rate of interest is one of the key concepts for understanding and interpreting macroeconomic relationships and the effects of monetary policy. Its modern usage dates back to the Swedish economist Knut Wicksell, who in 1898 defined it as the interest rate that is compatible with a stable price level.
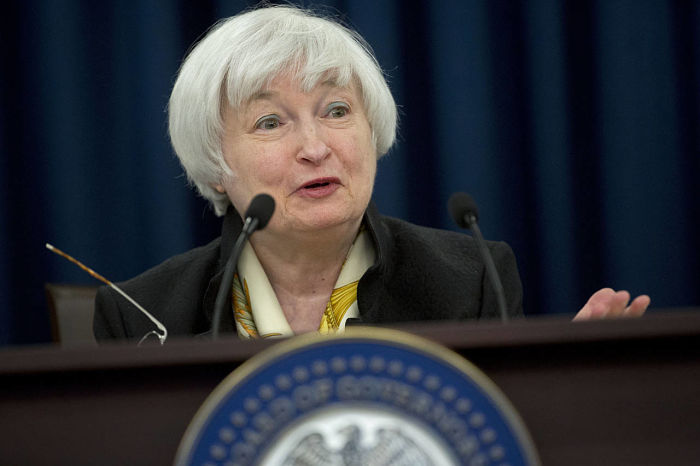
Fed Chairwoman Janet Yellen referred to the natural interest rate in a speech last summer, suggesting that this interest rate had declined over the last decade. She said that this decline was largely due to slower growth of the labor force, smaller productivity gains, and higher savings rates.
We think that in today’s global economy, where money flows freely across international borders, the natural level of interest rates is also influenced by global economic conditions, such as global economic growth, inflation, employment trends, and credit spreads.
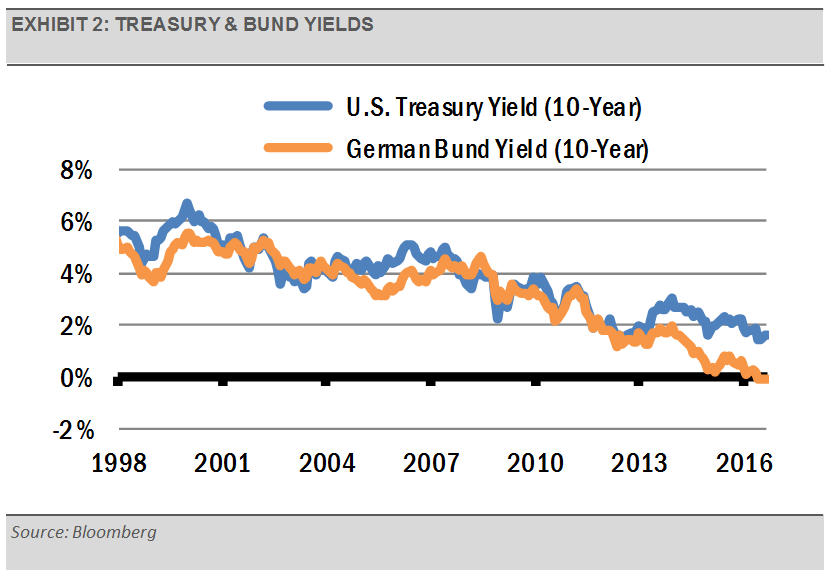
For example, if the German Bund, which is of a similar credit quality to the U.S. Treasury Bond, yields 1%, the Treasury Bond of a similar maturity will yield a similar rate, accounting for other costs, such as currency exchanges. If the Treasury moves sufficiently higher relative to the Bund, global investors will sell Bunds and buy Treasuries, causing the Bund’s rate to increase and the Treasury yield to decline.
Since long-term interest rates in other countries, such as Germany, affect long-term interest rates in the U.S., the Fed must pay attention to global markets outside of the U.S. when setting interest rate policies that are appropriate for the times: tightening when inflationary pressure is building and loosening when trying to spur growth.
Long-term interest rates are low globally, reflecting a sluggish economic growth environment and little inflationary pressure. These low long-term yields give the Fed little room to raise interest rates in our opinion.
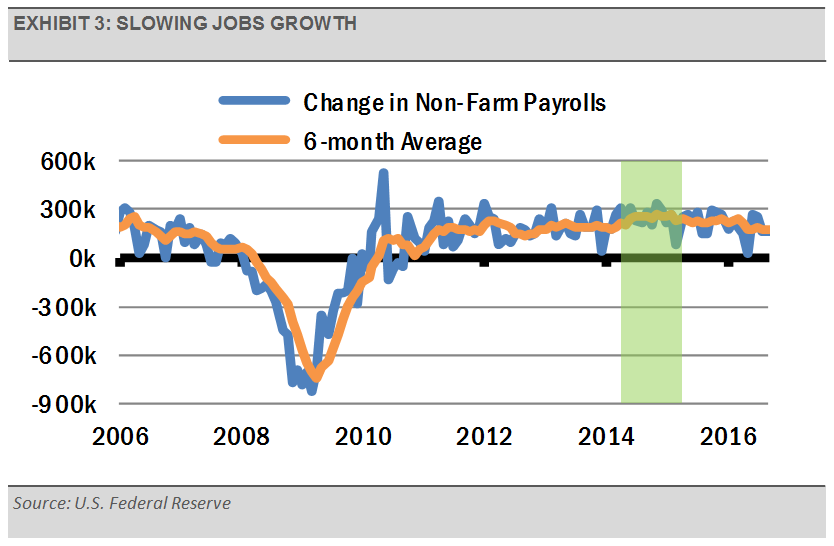
The September U.S. monthly employment report, released on October 7th, missed expectations as jobs creation cooled significantly from prior months. To reduce the month to month volatility in the jobs reports, we prefer to look at the rolling 6-month average. We think trends in the rolling average numbers are more important than the individual monthly reports.
The rolling 6-month average has settled at a rate significantly lower than in late 2014 and early 2015. Though the average current rate of jobs creation is near the low-end of the recovery range, these are not bad results. We think these numbers are reflective of an economy that continues to grow slowly and generate well-paying jobs.
Still, the declining rate of jobs creation is one of several risk factors that we are watching, and it suggests that the Fed should move cautiously going forward.
We think that if the Fed can be disciplined and wait for improving signs of jobs growth and increasing signs of inflation, the economy can continue to grow. As the economy grows, sales revenue should increase, along with corporate earnings. These trends can lead to positive financial market performance, which is our base scenario.
DISCLOSURES
Any forecasts, figures, opinions or investment techniques and strategies explained are Stringer Asset Management LLC’s as of the date of publication. They are considered to be accurate at the time of writing, but no warranty of accuracy is given and no liability in respect to error or omission is accepted. They are subject to change without reference or notification. The views contained herein are not be taken as an advice or a recommendation to buy or sell any investment and the material should not be relied upon as containing sufficient information to support an investment decision. It should be noted that the value of investments and the income from them may fluctuate in accordance with market conditions and taxation agreements and investors may not get back the full amount invested. Past performance and yield may not be a reliable guide to future performance. Current performance may be higher or lower than the performance quoted.
The S&P 500 Index is an unmanaged index of 500 stocks used to measure large-cap U.S. stock market performance. Investors cannot invest directly in an index. Index returns do not reflect any fees, expenses, or sales charges. Returns are based on price only and do not include dividends or other sources of income. Past performance is not a guarantee of future results.
The securities identified and described may not represent all of the securities purchased, sold or recommended for client accounts. The reader should not assume that an investment in the securities identified was or will be profitable. Data is provided by various sources and prepared by Stringer Asset Management LLC and has not been verified or audited by an independent accountant.