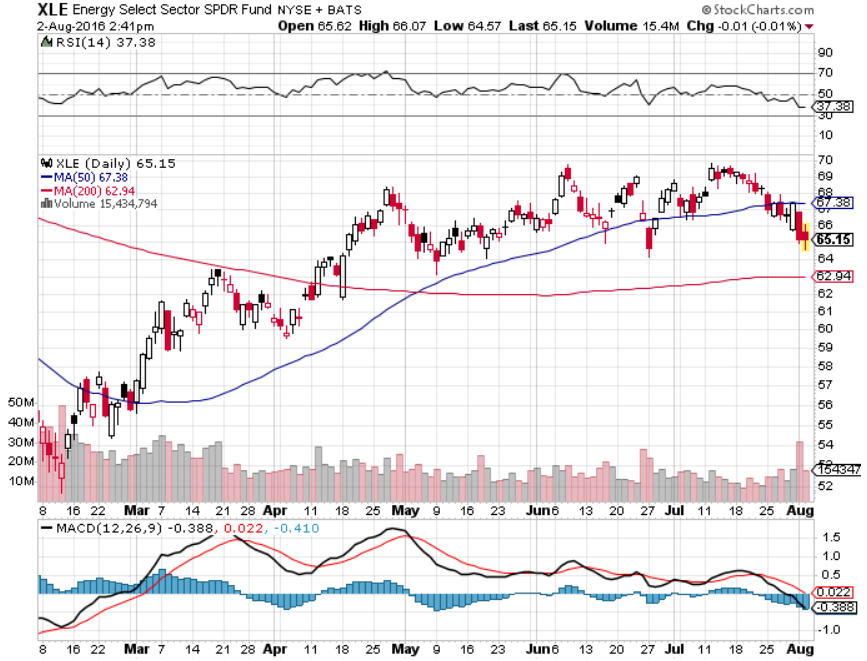
The third quarter is often unkind to the energy sector, a thesis that was proven accurate during a rough July for commodities, including oil prices. That theme is predictably weighing on equity-based energy exchange traded funds, such as the Energy Select Sector SPDR (NYSEArca: XLE), which until recently had been one of the better-performing sector ETFs on a year-to-date basis.
Rivals to XLE include the Vanguard Energy ETF (NYSEArca: VDE), iShares U.S. Energy ETF (NYSEArca: IYE) and the Fidelity MSCI Energy Index ETF (NYSEArca: FENY) and those ETFs are also viewed as vulnerable in the near-term, particularly with oil prices having recently entered another bear market.
Saudi Arabia also maintained output close to record highs as the top OPEC exporter tries to maintain market share and meets seasonally higher domestic demand.
SEE MORE: Why Investors are Bearish on Oil ETFs
Further fueling the oversupplied outlook, U.S. oil drillers added 44 rigs in July, the most in a month since April 2014, with the rig count going up eight times in nine weeks.
“Two weeks ago, we saw a breakdown below a rising wedge, with XLE closing under the five-week Simple Moving Average (SMA). Because the ETF bounced after a push under the 13-week SMA, the prudent approach — especially given the bullish nature of the market — was to wait for confirmation,” according to TheStreet.com.
[related_stories]For those seeking a hedge against further weakness in the energy sector, the ProShares Short Oil & Gas (NYSEArca: DDG) tries to reflect the inverse, or -100%, daily performance of the Dow Jones U.S. Oil & Gas Index.
The UltraShort Oil & Gas ProShares (NYSEArca: DUG) takes two times the inverse, or -200%, daily performance of the Dow Jones U.S. Oil & Gas Index. More aggressive traders can take a look at the Direxion Daily Energy Bear 3X Shares (NYSEArca: ERY), which reflects three times the inverse, or -300%, daily performance of the energy select sector index.
Moreover, the recently launched Direxion Daily S&P Oil & Gas Exploration & Production Bear Shares (NYSEArca: DRIP) takes the -3x, or -300%, daily performance of the S&P Oil & Gas Exploration & Production Select Industry Index.
SEE MORE: 32 Best ETFs to Track Crude Oil
“I would be very cautious here, in terms of energy. Shorts should use the top of the wedge, $70, as a stop. If I were long, I would get hedges into play now. I do think the $58 to $62 range will develop as a new trading range should the breakdown continue. My inclination would be to anticipate a bounce back into the $67 to $68 area first, and then a fade into a new range,” according to TheStreet.
For more information on the Oil ETFs, visit our Oil category.
Energy Select Sector SPDR