

So, why invest in anything else? Well, equities carry with them the unfortunate tendency to substantially decline in value at unpredictable times. Diversifying into asset classes sufficiently different from equities is a way to buffer equity downside risk.
However, the risk mitigation thus offered by diversification is indirect and far from guaranteed. Indeed, equity drawdowns of significant degree have been known to drag many other asset classes down with them. Would it not be better, more direct, and less uncertain if you could find a way to embed downside risk mitigation explicitly within the equity investment itself? This, of course, is what RMI is all about.
We have presented this view earlier in this series, but now we are ready to examine it more rigorously — in the context of MPT’s efficient frontier.
Putting RMI to the MPT Test
To insert an RMI investment into an MPT optimization exercise, it is first necessary to estimate its expected return, volatility, and correlation with other asset classes. The actual historical performance of the RMI investment could be used to estimate those parameters in the same way they are estimated for the more traditional asset classes. If prior live history is not long enough (ideally, several full bull/bear market cycles should be represented), there are alternative methods. One method, if the RMI strategy is completely rules-based, is to simply model its prior performance mathematically. Another method is to express the RMI strategy’s performance in “deductible/copay/cost” terms as described in our earlier piece, The Tolerable Cost of Risk-Managed Investing, and estimate the parameters relative to the corresponding parameters of a standard index such as the S&P 500 Index.
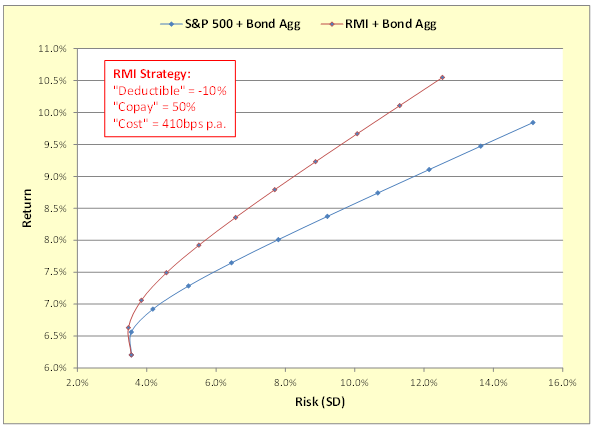
We applied the latter method using an RMI strategy with a “deductible” of -10%, a “copay” of 50%, and a “cost” of 410 basis points per year — that is, the downside protection kicks in when the S&P 500 Index suffers a drawdown of -10% or worse, the protection mitigates 50% of any subsequent decline net of the cost of the protection, and the performance drag relative to the S&P 500 during periods when the protection is not needed is 410 basis points per annum. In the chart below we plot, in blue, the efficient frontier of a two-asset stock/bond portfolio, using the S&P 500 Total Return Index and the BarCap Aggregate Bond Total Return Index to represent the two assets. Twenty years of daily return data (December 30, 1994 through December 31, 2014) was used, and rebalancing was ignored for simplicity. On the same chart we plot, in red, the efficient frontier obtained by substituting for the S&P 500 the RMI investment we just described. The red, RMI-enhanced, frontier is seen to be elevated above the blue.
Importantly, this type of improvement in the risk/return profile of the portfolio can be expected whenever a cost-effective RMI strategy is introduced.
The implications of this phenomenon are profound. We will examine the implications for portfolio performance measurement and benchmarking in our next installment. And, in the final piece of this series, we will explore the potentially paradigm-shifting implications for the future of investing.
This article was written by Jerry Miccolis, Gladys Chow and Rohith Eggidi of Giralda Advisors, a participant in the ETF Strategist Channel.