

Note: This article appears on the ETFtrends.com Strategist Channel
By Grant Engelbart, CFA
Factors have become widely-agreed-upon drivers of risk and return, backed by academia and practitioners alike. Explanations for outperformance have been cataloged from both a fundamental and behavioral perspective. Factors have transitioned from anomalies to truths in many circles. One market anomaly recognized for decades (perhaps longer) has been the idea of seasonality in the stock market. The “Santa Claus Rally,” “January Effect,” and “Summer Swoon,” have all been recognized patterns of persistence. Seasonality, however, has not taken on the same academic truth as factors; nonetheless, it’s possible they can coexist.
Seasonality can prompt a variety of behaviors, whether avoiding Mondays or capitalizing on turn-of-the-month effects. But, perhaps the most visible imprint of seasonality on the markets is the relative slowdown of the summer months. Whether measured since the turn of the century, post-World War II, or Volcker era, the S&P 500 and global stock market (measured by MSCI ACWI) have outperformed during the November to April period.
Related: No, This is Not an Ugly Chart on Factor Investing
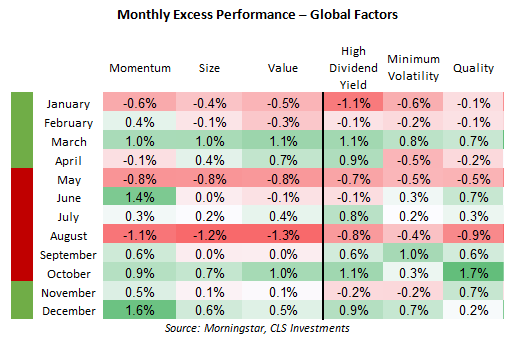
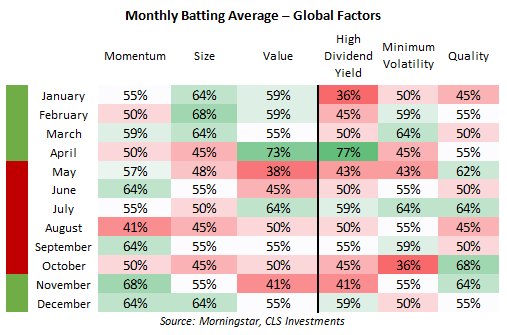
Turning to Factors, March, October, and December have been the best months for global factors to outperform the broader ACWI Index, while January, May, and August have been the worst. This is true for both excess performance and batting average, or the percentage of time the factor outperforms the parent index. Cyclical factors (left side on the chart below) tend to do somewhat better during the stronger seasonal period of November to April, while defensive factors (right side) tend to hold up better in the lackadaisical summer months. (Note: it is questionable whether high dividend yield is cyclical or defensive, as the factor splits its time below or above the risk of the broad market historically).
Source: CLS Investments, Morningstar, MSCI
Looking at individual factors, there are a few interesting tidbits. On average, size underperforms in January, contrary to conventional thought, albeit at a low percentage. Quality does best in January. Window dressing in December would potentially lead to the opposite effect, as quality stocks would be sold in January and smaller cap stocks purchased.
Interestingly, April has a strong tendency for outperformance by value-oriented factors (value and high dividend yield), both outperforming more than 70% of the time. Perhaps investors get excited about Berkshire Hathaway’s annual meeting in late April/early May and pile into value stocks? Obviously not; a more likely explanation could be the strong seasonality of crude oil during April relating to refinery maintenance, summer driving demand, and the switchover to summer-blend fuels – all of which have historically helped propel energy stocks (classic value names) higher.
Related: An Equation to Identify the Next Market Bubble?
One final observation here – these indices are rebalanced at the end of May and November. There doesn’t seem to be a meaningful performance or batting average result the month following rebalance for all factors, but it could potentially be argued that momentum sees some impact from fresh index holdings in June and December.
Source: CLS Investments, Morningstar, MSCI
While this may seem like voodoo to some, it is possible to conceptualize several strategies, with a little engineering, from the historical seasonality of various factors. A simple way to take advantage of different market environments would be to favor cyclical factors during strong months (November-April), and defensive factors during weaker months (May-October).