Note: This article appears on the ETFtrends.com Strategist Channel
By David Haviland
One of the key tenets of Modern Portfolio Theory (MPT) is the ability to diversify a portfolio among varying asset classes in an attempt to realize a higher return and lower volatility than the average portfolio investment. In theory, diversification provides the one “free lunch” available to investors; more return for less risk.
While the goal is noble, recent history has shown that supposed diversification can be a fool’s errand. During extended periods of market failure…true bear markets, the correlation between risk assets begins to move towards one. This increased correlation completely negates the benefits of diversification, and has many ramifications for our industry. As new products are created and portfolio construction includes more and more “diversifiers”, those relying solely on this alleged diversification to protect against large portfolio losses may be sorely disappointed. Caveat emptor!
Related: Bonds Have Bear Markets Too, Remember?
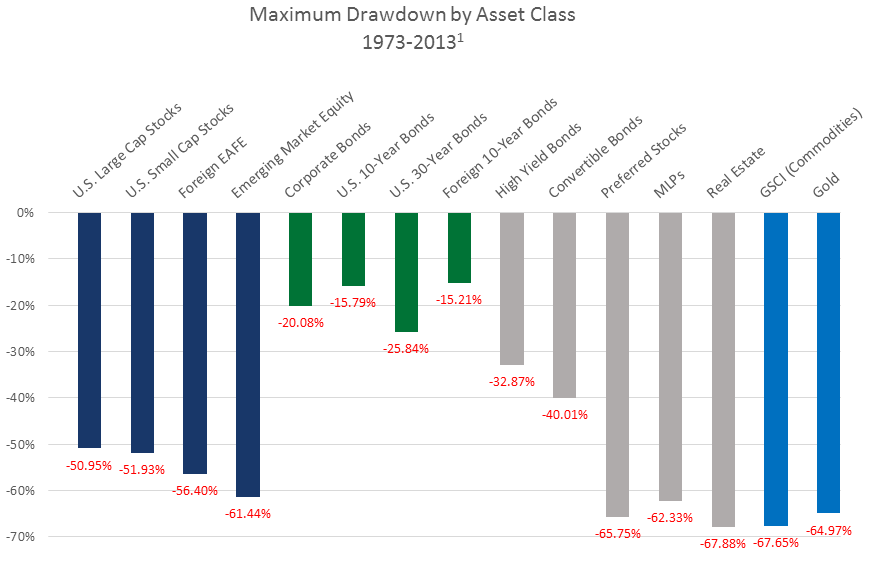
Risk assets are just that, risky! The further an investor ventures away from large, liquid markets, the more unforeseen risk is taken on by a portfolio. As the chart below shows, when global stock markets endured their bear market in 2007-2009, varying geography, market capitalization and specific industry selection offered little protection against major losses. In fact, many of these “diversifiers” against portfolio risk had larger drawdowns than the S&P 500® Index!
Since the majority of bonds have enjoyed a general decline in interest rates since the macro interest cycle peaked in 1981, you must go back a few decades to see how they responded to rising interest rates and their own bear markets. The exception is high yield or junk bonds which experienced their largest drawdown in the 2007-09 bear market, when the IBoxx Liquid High Yield Index fell 32.87%!
The reasons for these large drawdowns are vary. Ours is now a global economy. If a bear market starts in one corner of the globe, it is rare that the rest of the world does not follow suit. Getting more specific, some asset classes simply are not as liquid as broad equity markets and buyers disappear when they are needed most.
For example, the benefits of using Real Estate Investment Trusts (REITS), preferred stock or Master Limited Partnerships (MLPs) are often overstated, but they do not diversify…you still own stocks, just a more specific group of them! Another more counterintuitive reason diverse asset classes can correlate to one revolves around selling winners for tax or margin call reasons. Gold and commodities started the 2007-09 bear market in good shape, but by the time margin call and tax selling took hold, they both had significant drawdowns of their own.
Related: Using Total Return to Meet Your Clients’ Income Needs
Why is this important? To address retirement income needs in a low interest and dividend environment, there have been a plethora of new strategies created using these “diversifiers” to create “safer” portfolio alternatives versus simply using stocks and bonds.
Our industry has started to use the diversifiers, often touted as “alternatives”, in many products such as 529 plans, Exchange Traded Funds (ETFs), Target Date Funds for retirement plans or in separate account management. We have heard and read too many product pitches that ignore or omit the necessary facts. When you need these different asset classes to offer different return characteristics when stocks enter a period of failure…most simply do not deliver.
In summary, diversification by itself does not automatically equate to a safer portfolio or a portfolio with low risk characteristics. Know what you are investing in, why you are investing in it and what may happen in the next bear market.
Don’t rely solely on diversification in a static portfolio to help you manage through market volatility. Consider tactical, rules based strategies as a supplement to overall portfolio construction to help mitigate some of the market volatility and possible future large losses. Prepare your portfolios now for the inevitable bad times as all markets and all asset classes eventually enter into periods of failure…and could potentially do it at the same time.
Are you ready?
David Haviland is a Managing Partner and Portfolio Manager at Beaumont Capital Partners, a participant in the ETF Strategist Channel.
[related_stories]
Disclosures:
1 Source: Global Asset Allocation (Chapter 3), Meb Faber, March 6, 2015. Bloomberg for the period 1973-2013. The data shown for Convertible Bonds, Preferred stock, High Yield Bonds and MLPs is sourced by Bloomberg. They use the same end date as the rest of the asset classes (12/31/13), but have different starting dates due to the fact the indices for these asset classes did not exist in 1973. Convertible bonds is for the time period starting on 6/17/1986, Preferred stock data starts 9/9/2003 and the MLP data begins 12/21/1995. The returns shown are “Nominal Returns” for the time period specified. “EAFE” represents the regions of Europe, Australasia and Far East.
In the chart above, asset class performance is represented by the following: U.S. Large Cap – S&P 500 Index; U.S. Small Cap – Fama/French Small Cap; Foreign Developed – MSCI EAFE Index; Foreign Emerging – MSCI Emerging Market Index; Corporate Bonds – Dow Jones Equal Weight U.S. Issued Corporate Bond Index; T-Bills – U.S. Bills; 10 Year Bonds – U.S. 10-year bonds; 30 Year Bonds – U.S. 30-year bonds; 10 Year Foreign Bonds – Foreign 10-year bonds; High Yield – iBoxx Liquid High Yield Index; Convertible Bonds – Vanguard Convertible Securities Fund; Preferred Stocks – S&P Preferred Stock Index; MLPs – Alerian MLP Index; REITs – FTSE NAREIT US Real Estate Index; Commodities – S&P GSCI; Gold – USD Spot Gold Price.
Diversification does not ensure a profit or guarantee against a loss.
Performance data shown represents past performance and is no guarantee of future results. Investment return and principal value will fluctuate, and you may have a gain or loss when shares are sold. An investment cannot be made directly in an index.
The Standard & Poor’s (S&P) 500® Index is an unmanaged index that tracks the performance of 500 widely held, large-capitalization U.S. stocks. Indices are not managed and do not incur fees or expenses. “S&P 500®” is the registered mark of Standard & Poor’s Financial Services, LLC, a part of McGraw Hill Financial, Inc. The Fama/French Small Cap, an indexed portfolio based on academic research, that is meant to mimic the risk factor in returns related to size, is the simple average of the returns on three small-stock portfolios categorized by book-to-market equity. The MSCI EAFE Index is an equity index which captures large- and mid-cap representation across Developed Markets countries around the world, excluding the US and Canada. With 926 constituents, the index covers approximately 85% of the free float-adjusted market capitalization in each country. The MSCI Emerging Markets Index captures large- and mid-cap representation across 23 Emerging Markets (EM) countries. With 836 constituents, the index covers approximately 85% of the free float-adjusted market capitalization in each country. The Dow Jones Equal Weight U.S. Issued Corporate Bond Index is an equally weighted basket of 96 recently issued investment-grade corporate bonds with laddered maturities. The index intends to measure the return of readily tradable, high-grade U.S. corporate bonds. It is priced daily. U.S. Bills, U.S. 10-year bonds, U.S. 30-year bonds, and Foreign 10-year bonds are represented by sovereign bills, notes, and/or bonds with a similar time to maturity as presented. The iBoxx $ Liquid High Yield Index is a rules-based index consisting of liquid U.S. dollar-denominated, high yield corporate bonds for sale in the United Sates. The index is designed to provide a broad representation of the U.S. dollar-denominated high yield liquid corporate bond market. There is no limit to the number of issues in the index. This Vanguard Convertible Securities Fund invests in bonds that can be converted into stocks at a predetermined price. The fund seeks to provide some of the upside of investing in the stock market, while limiting the downside risk to your principal. Convertible securities generally have lower credit quality or are unrated, which also exposes the fund to credit risk. The S&P U.S. Preferred Stock Index is designed to serve the investment community’s need for an investable benchmark representing the U.S. preferred stock market. Preferred stocks are a class of capital stock that pays dividends at a specified rate and has a preference over common stock in the payment of dividends and the liquidation of assets. The Alerian MLP Index is the leading gauge of energy Master Limited Partnerships (MLPs). The float-adjusted, capitalization-weighted index, represents approximately 85% of total float-adjusted market capitalization. The FTSE NAREIT US Real Estate Index Series is a comprehensive family of REIT-focused indexes that span the commercial real estate industry, providing market participants with a range of tools to benchmark and analyze exposure to real estate across the US economy at both a broad industry-wide level and on a sector-by-sector basis. The S&P GSCI is the first major investable commodity index. It is one of the most widely recognized benchmarks that is broad-based and production weighted to represent the global commodity market beta. The index is designed to be investable by including the most liquid commodity futures, and provides diversification with low correlations to other asset classes. Gold is represented by the USD Gold spot exchange rate.
This material is provided for informational purposes only and should not be taken as investment advice. The material may contain forward or backward-looking statements regarding intent, beliefs regarding current or past expectations. Any conclusions or assumptions described are to illustrate potential benefits, however are not guaranteed. The information presented is based on data obtained from third party sources. Although it is believed to be accurate, no representation or warranty is made as to its accuracy or completeness.
As with all investments, there are associated inherent risks, including principal risk.

