Oil prices and energy stocks are rebounding this year, but big-name energy stocks and exchange traded funds (ETFs), such as the Energy Select Sector SPDR (NYSEArca: XLE) have been retreating in recent days, perhaps inviting once eager short sellers to revisit the energy patch.
XLE and rival energy ETFs, such as the Vanguard Energy ETF (NYSEArca: VDE), iShares U.S. Energy ETF (NYSEArca: IYE) and the Fidelity MSCI Energy Index ETF (NYSEArca: FENY), have been solid performers this year but nearly all of the marquee energy ETFs remain well below the highs set a couple of years ago.
Oil majors have tightened their belts, reducing costs by laying off thousands of workers and halted many new projects. Large integrated oil companies are expected to hold up better than drilling stocks as these giants have both upstream exploration and production, along with downstream refining operations.
Related: 12 Rebounding Energy ETFs
Concerns over Chinese oil demand also pressured prices. China revealed that its service activity expanded at a slower-than-expected pace, which has fueled pessimism over a potential slowdown in the second largest oil-consuming country in the world.
[related_stories]There are some bearish signs mounting.
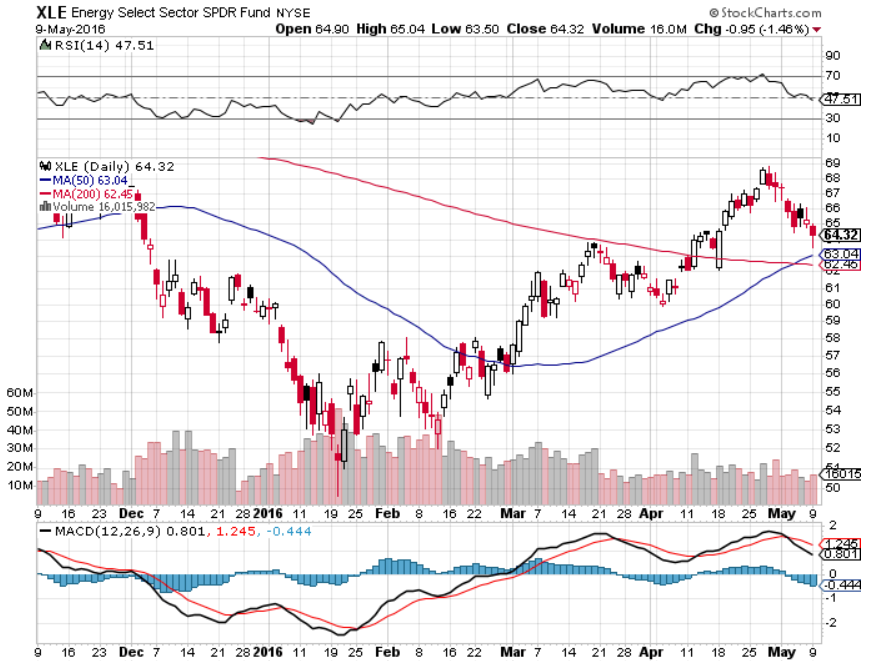
XLE’s “price action began to roll over at the end of last week and followed through this week. The 10 day ema was acting as support and, as is often the case, became resistance once it was breached on Tuesday. Despite daily attempts, the XLE was rejected at the 10day ema for the remainder of the week. Price then went on to breach the 20 day ema on Friday to close out an ugly week, which saw the ETF down 3.3%. The one bright spot is that it managed to hold horizontal support at $64.85. Further support below sits at $64 and then at $63.29 which is the 50 day ema,” according to See It Market.
For those seeking a hedge against further weakness in the energy sector, the ProShares Short Oil & Gas (NYSEArca: DDG) tries to reflect the inverse, or -100%, daily performance of the Dow Jones U.S. Oil & Gas Index.
The UltraShort Oil & Gas ProShares (NYSEArca: DUG) takes two times the inverse, or -200%, daily performance of the Dow Jones U.S. Oil & Gas Index. More aggressive traders can take a look at the Direxion Daily Energy Bear 3X Shares (NYSEArca: ERY), which reflects three times the inverse, or -300%, daily performance of the energy select sector index. Moreover, the recently launched Direxion Daily S&P Oil & Gas Exploration & Production Bear Shares (NYSEArca: DRIP) takes the -3x, or -300%, daily performance of the S&P Oil & Gas Exploration & Production Select Industry Index.
Related: 32 Best ETFs to Track Crude Oil
On XLE’s weekly chart “XLE was able to hold on to the rising trend line despite the weakness in the sector. The bounce occurred right at the intersection of the rising trend line and the 50 week moving average. For now it is still within this ascending triangle. We’ll know soon if bulls have the conviction to push this back up and through the top of the triangle at $69 or whether it resolves lower and goes on to test the 2 and a half year downtrend line,” adds See It Market.
For more information on the Oil ETF market, visit our Oil category.
Energy Select Sector SPDR