As oil prices have surged to their highest levels since late 2015, plenty of equity-based exchange traded funds are getting in on the act. That includes ETFs devoted to exploration and production companies, such as the volatile SPDR S&P Oil & Gas Exploration & Production ETF (NYSEArca: XOP).
All XOP has done is surge 23.5% over the past month, but that move has some traders pondering a near-term pullback for the ETF. Still, making the sector’s rebound this year all the more impressive is that it comes against the backdrop of still low oil prices, little help in the way of significant production cuts and massive spending reductions by global oil majors.
Oil majors have tightened their belts, reducing costs by laying off thousands of workers and halted many new projects. Large integrated oil companies are expected to hold up better than drilling stocks as these giants have both upstream exploration and production, along with downstream refining operations.
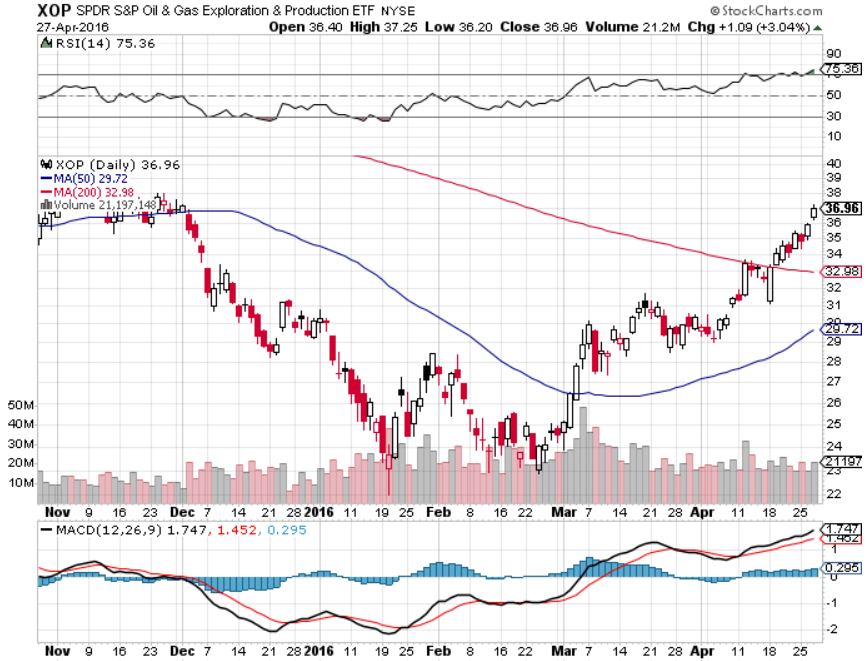
“When the RSI hits 30, as a generalization it’s oversold. When it hits 70, it is overbought,” We see the RSI here hitting that 70 point level. Last time it hit 70, it was back in October. What happened? XOP started to head downward, so I think the XOP can head lower,” said Andrew Keene of AlphaShark in a CNBC interview.
[related_stories]Concerns over Chinese oil demand also pressured prices. China revealed that its service activity expanded at a slower-than-expected pace, which has fueled pessimism over a potential slowdown in the second largest oil-consuming country in the world [Read more: China ETFs Suffer New Year Hangover].
Additionally, the international outrage over Saudi Arabia’s execution of a Shi’ite cleric ended speculation that Organization of Petroleum Exporting Countries could come together on a production cut, reports Simon Falush for Reuters [Read more: Oil ETF Bears Continue Aggressive Forecasts].
There is good news for XOP and that includes estimates that some U.S. shale producers can remain profitable with oil at current prices, perhaps even down to $35 per barrel.
“U.S. production reached a peak of 9.6 million barrels a day in April 2015, six months after OPEC moved to a market-based strategy that sent prices skidding. U.S. oil output was lifted by the industry’s recently completed projects, and production was also supported by hedging, ready financing and technology gains. But financing is no longer easy, and some producers face real hardship, including fire sales or bankruptcy,” according to CNBC.
Other ETFs with exploration and production exposure include the PowerShares Dynamic Energy Exploration & Production Portfolio (NYSEArca: PXE) and the Guggenheim S&P Equal Weight Energy ETF (NYSEArca: RYE).
Want more Oil ETF news and analysis? Visit www.etftrends.com/oil
SPDR S&P Oil & Gas Exploration & Production ETF