

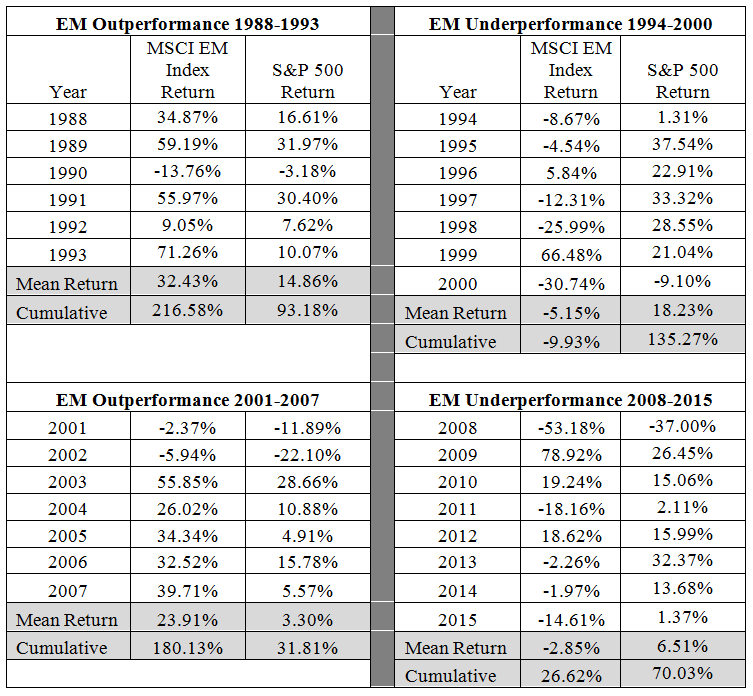
Since the financial crisis, the S&P 500 has once again assumed leadership through the end of 2015 with positive mean returns of 6.51% versus -2.85% for EM equities. While a short data set overall, it is interesting to note that the cycles have tended to last 6-8 years before leadership change occurs.
Given this data, what are investors to make of these cycles in terms of investment decision making today?
Below are some thoughts investors should likely consider.
- There appears to be historical context to the more recent EM equity experience of underperformance. There have been two distinct and substantial periods where EM equities have underperformed domestic stocks. These periods have historically been followed by relatively large outperformance of EM stocks compared to domestic stocks. The recent period does not look considerably different than historical periods.
- While many factors influence EM equity returns and the past is not necessarily a predictor of future results, investors may be speculating if they doubt the cycle will once again turn. Thus far in 2016, the MSCI EM Index is up 2.73% whereas the S&P 500 Index is up 0.20% as of 3/28/16. While a short time frame and presenting no predictive power, it is interesting to note 2016 performance given the length of the most recent cycle.
- Given the cycles exhibited, there are likely diversification benefits in having a portfolio allocation to EM equities. In fact, the correlation coefficient between the MSCI EM Index and the S&P 500 index since 12/31/1987 is quite low at 0.491. When domestic equities are struggling, EM equities may be a needed growth engine for portfolios. If a portfolio is truly diversified, some asset classes should be going down when others are going up.
- EM equities have historically been more volatile than domestic equities. The standard deviation of returns for the MSCI EM Index since inception has been roughly 33%1, whereas the S&P 500 Index has been about 17.5%1 over the same time frame. It is important to consider this difference in volatility, however when considered with the historical return sequences and relatively low correlation, modest EM equity portfolio allocations seem reasonable for many investors with some tolerance for risk.
- Most investors should likely invest in a broad based, low cost exchange traded fund (ETF) like the Vanguard Emerging Markets ETF (VWO) or iShares Core Emerging Markets ETF (IEMG) rather than trying to pick individual country ETFs or individual stocks. In a volatile asset class, trying to pick potential country specific ETFs or individual stock winners may prove counterproductive. A broad, low cost strategy will likely lead to the highest chance of success in capturing positive EM equity cycles.
- Do not try to time the cycles. A recent study by Emerging Global Advisors[3] found that missing a small amount of trading days can seriously impact returns with EM equity investing. According to the study, “Total returns for the MSCI EM Index since 1/3/2000 to 10/30/2015 has been 151%, but this number falls sharply if the best daily returns are excluded”. In fact, missing the 16 best days out of the 4,131 total days during the referenced period resulted a negative return compared to the 151% had an investor not missed the best 16 days. It seems unlikely investors can accurately predict the best 16 days out of 4,131.
In summary, while many investors are rightfully questioning the merits of holding a strategic position in EM equities, they should likely broaden their view of the asset class and consider the various historical cycles exhibited since 12/31/1987. With a broader viewpoint, investors may deduce that the recent EM equity experience is not significantly different than history may suggest. Investors may also infer that a strategic EM equity allocation may prove useful for portfolio diversification when domestic equities are not exhibiting strong performance, which also has historical context.
ValMark Advisers, Inc. (“ValMark”) is a federally registered investment adviser located in Akron, Ohio. ValMark and its representatives are in compliance with the current registration and notice filing requirements imposed upon federally covered investment advisers by those states in which ValMark maintains clients. For registration or additional information about ValMark, including its services and fees, a copy of our Form ADV is available upon request by contacting ValMark at 1-800-765-5201. This article provides commentary on current economic and market conditions and is not directly relevant to any particular client account. The information contained herein should not be construed as personalized investment advice or recommendations to buy or sell any security. There can be no assurance that the views and opinions expressed in this article will come to pass. Investing involves the risk of loss, including the loss of principal. Past performance is no guarantee of future results. Information contained herein is subject to change without notice and should not be considered as a solicitation to buy or sell any security. Indexes are unmanaged and cannot be directly invested in. TOPS® is a registered trademark of ValMark Advisers, Inc. Diversification does prevent or guarantee against loss.
[1] Data from Morningstar Direct. Data assumes dividends are maximally reinvested.
[2] https://www.msci.com/emerging-markets
[3] EG Shares: Market Timing vs. Time in the Markets. http://emergingglobaladvisors.com/emergingperspectives/article.php?url_key=market-timing-vs-time-in-the-market
Important Disclosure: VWO and IEMG have been, may be and/or are currently held in several TOPS Portfolios. ValMark Advisers, Inc. (“ValMark”) is a federally registered investment adviser located in Akron, Ohio. ValMark and its representatives are in compliance with the current registration and notice filing requirements imposed upon federally covered investment advisers by those states in which ValMark maintains clients. For registration or additional information about ValMark, including its services and fees, a copy of our Form ADV is available upon request by contacting ValMark at 1-800-765-5201. This article provides commentary on current economic and market conditions and is not directly relevant to any particular client account. The information contained herein should not be construed as personalized investment advice or recommendations to buy or sell any security. There can be no assurance that the views and opinions expressed in this article will come to pass. Investing involves the risk of loss, including the loss of principal. Past performance is no guarantee of future results. Information contained herein is subject to change without notice and should not be considered as a solicitation to buy or sell any security. Indexes are unmanaged and cannot be directly invested in. TOPS® is a registered trademark of ValMark Advisers, Inc. Diversification does not prevent or guarantee against loss.