

Note: This article is part of the ETF Trends Strategist Channel
Written by Beaumont Capital Management
When looking back to examine what has happened to various investments in the past, we must be careful about the length of the data set used and the bias it can create. Historical bond returns are a classic example.
Using only the last 35 years to analyze bonds and bond returns renders a data set is so full of declining interest rate bias that any conclusions drawn about the future are bound to be askew or worse.
The U.S. interest rate increases started in earnest in the late 1960’s with the effects of the Vietnam War (guns and butter pressure on inflation), the massive consumer spending caused by the baby boom (Americans spend more on their children than on anything else), and the 1973-74 OPEC oil embargo which helped drove up energy prices 400% in just two short years.
Inflation skyrocketed in the U.S. and the then current Federal Reserve (Fed) Chairman Volker had to impose a form of economic “chemotherapy”…he raised interest rates so high that they stifled any further inflation and, for a time, most economic growth. This economic choke-hold was designed and destined to return our inflation and interest rate environment to “normal”. Yet interest rate normalization has taken the better part of 35 years! The full cycle is over 50 years. Have we, as an industry, succumbed to this rate bias and set ourselves up for an unforeseen bear market that could have massive ramifications?
Today the most referred to bond index, the Barclay’s Aggregate Bond Index (BCAB, formerly Lehman Aggregate Bond Index) did not exist at the beginning of this 50 year cycle. The first iteration of the BCAB was created in 1973 but returns for only a part of the aggregate index, the Government/Corporate sub-index, started in 19761. The mortgage backed, Yankee and Aggregate Indices were created in 1986 and back tested to 12/31/751.
In short, the BCAB has evolved over time and become the “standard” bond benchmark for our industry today. On a total return basis (price movement plus coupon return), since inception the BCAB has only had negative returns in in three calendar years: 1994 (-2.92%), 1999 (-0.82%) and 2013 (-2.02%). Due to these modest declines, many have drawn the conclusion that bonds are “safe” and never lose a lot of money. This, of course, is not true.
Yet the BCAB, the financial industry’s most often cited bond index, is too new to tell a complete story. Think about it…our industry’s main comparison for bond returns is completely subject to the declining interest rate bias noted above. For this reason, we will focus on the 10 year U.S. Treasury (10 Yr UST) as our representative bond proxy as it has a much longer dataset that transcends the 50 year bond “super-cycle”.
The main reason there were no large total return bond losses in the last 35 years is because the bond’s coupons were so high due to the Volker Fed’s rate increases that they covered up the declining price movement. Yes, higher coupons bring lower bond duration, but let’s use a simplistic example. If a 10 year (in duration) U.S. Treasury lost -10% in a given year while the coupon was 8%, then the yearly total return would have been -2%. But now that the 10 year U.S. Treasury yield is below 2%, that same -10% price decline would bear a -8% total return. That can come as quite a shock to retirees who have poured trillions into bonds to produce income to fund their retirement.
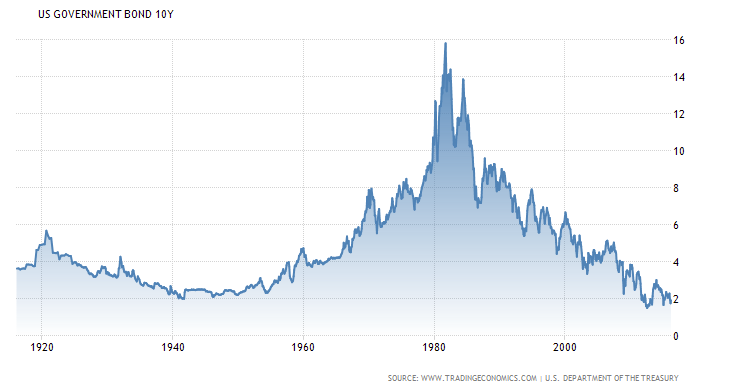
The above chart of the 10 Yr UST bond, which goes back 100 years, draws a completely different picture as to what historical interest rates have been and what a “normal” rate range might look like. The 10 Yr UST has spent more time with its interest rate between 2-5% than it has above 5%.4 Is this normal? Perhaps.
Once again caution must be invoked. If the 2-5% range of the 10 Yr UST yield from 1915 to ~1965 is to be considered normal, then we need to normalize the data. In 1971 the U.S. came off the gold standard. Pre 1971, our Government’s debt was backed by more than a promise to pay…it was backed by gold and silver. This had a stabilizing effect on price/yield and the lack of this stabilizing effect needs to be considered when looking forward2. Furthermore, in times of war, it was typical for the U.S. Government to control interest rates. We do not know if the U.S. Government will impose similar controls in the future.
We believe size does matter.
The $19 trillion of current U.S. Federal debt is much larger than at the end of World War II when our debt was $251 billion. Yes, as a percent of GDP these amounts are similar at around ~110% of GDP3, but what if there is a sudden surge to sell? Does size matter? It can when people want to sell all at once! For example, let’s say a small number of bondholders want to sell, maybe 2%. 2% of $19 trillion or $380 billion can have a much greater effect on price than 2% of $251 billion or only $5 billion. It all comes down to a simple premise: Is there an incremental buyer for the bonds for sale and at what price? Note we have not included corporate debt or municipal debt in this simple example. At the end of 2014, total U.S. debt outstanding was $60 trillion4. That means if 2% was put out for sale, $1.2 trillion of selling pressure will hit the U.S. bond market. 5% selling pressure means $3.75 trillion goes up for sale.
Please see the charts below from the Wall Street Journal. They illustrate other reasons that bond liquidity, due to the size of the bond markets, may create additional risk to bond prices. In short, as rates rise, losses mount and selling pressure increases. As it does, it will likely become harder and harder to find an incremental buyer for the amount of bonds for sale. For brevity’s sake, we will not go into the bond derivative market and the possible devastating effects leverage can bring to the bond markets. The 2007-2009 credit and banking crisis has already proven this premise.
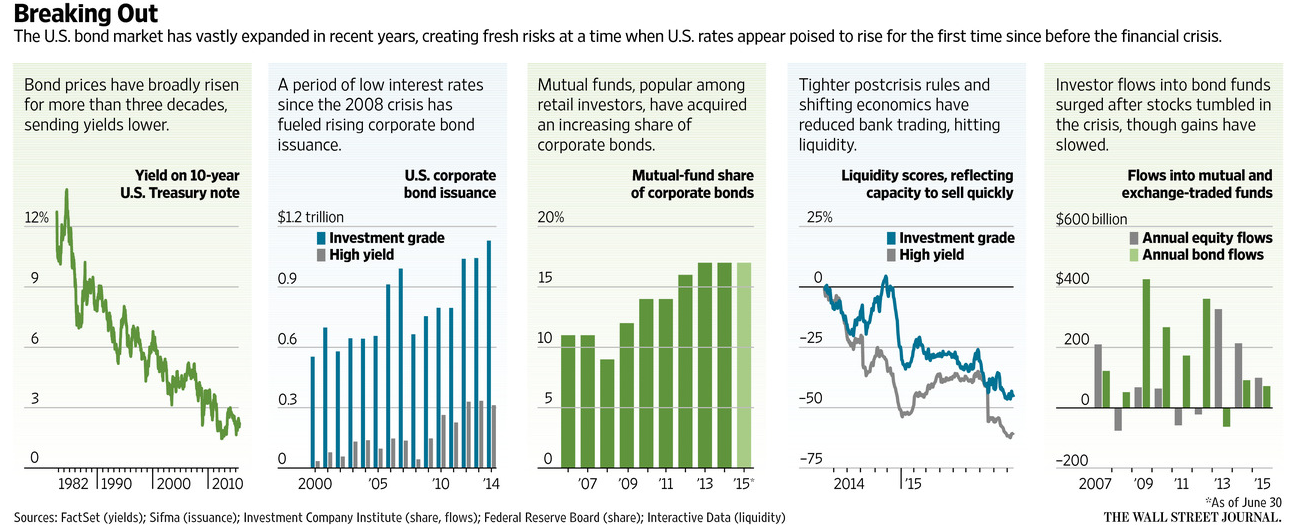
It has been pointed out by the Wall Street Journal that about 90% of bond returns were derived from the starting interest rate of each bond5. With the yields on the 10 Yr UST bond just under 2%, what are reasonable return expectations going forward if interest rates stay range bound? What if interest rates rise for any reason?
Calculating bond losses involves a simple equation:
The duration of the bond (bond ETF or fund) x interest rate increase = expected loss.