

A modest rise in interest rates, let’s use 2% in a year, will bring a 20% price loss to a U.S. Treasury bond with a 10 Year duration. With the current coupon just under 2%, this would bring a total return of -18%! Is it conceivable that interest rates could rise 2% over 12 months if inflation heats up and/or the Fed raises rates? The last time the Fed raised rates in 2004-2007, they increased the Federal Funds rate by .25% seventeen times. In 2005 alone, they raised short term rates 2%6 and these rate increases were reflected, at least in part, across the yield curve. Year end to year end, the 10 Yr UST has had annual yield increases of 1.5% to 2.02% seven times in the last 100 years. If we widen out to 18 months and use non-year end data the frequency increases dramatically. Rate increases and bond losses do happen! In 1994, the 10 Yr UST lost 8.04%, in 1999 it lost 8.25%, in 2013 it lost 9.1% and in 2009 it lost 11.12%.
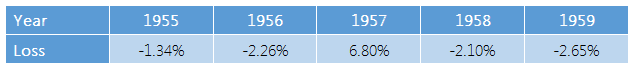
What about sustained bond losses over longer time periods? Yes, this has happened as well. The years 1955-1959 saw the 10 Yr UST lose money 4 out of 5 years6:
So far this paper has focused on the 10 Yr UST. In addition to the issues noted above, bonds can be subject to credit and default risk, rating downgrades, liquidity risks for certain issuers and reinvestment risk (in lower yielding bonds). High yield or junk bonds often have had the tendency to have return streams more similar to equity than other bonds. International bonds have to account for political/military risks and currency fluctuation. As a general rule, the higher the coupon the greater the risk(s). For example, in 1994 the BCAB had a modest loss yet many bond funds had disproportionately large losses due to credit and other risks7. In 2008 credit risk struck again: the BCAB was positive 5.24% yet, according to Morningstar, 65 intermediate term U.S. bond managers lost at least 8% and a dozen lost more than 15%7. Investors were not happy!
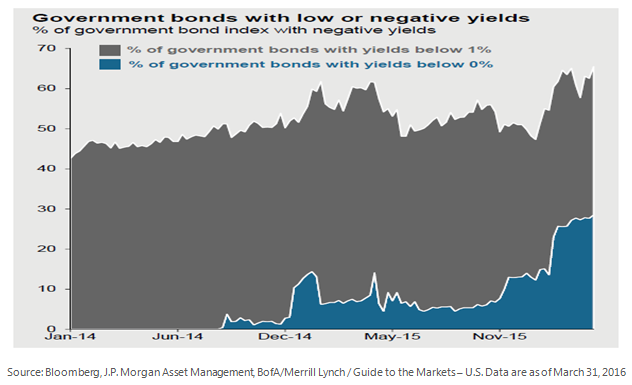
So why the concern? We all know interest rates are low across the globe. As the chart below shows, of all the Government bonds issued and outstanding today, including all maturities, almost two thirds have a yield below 1% and over one quarter have negative yields!
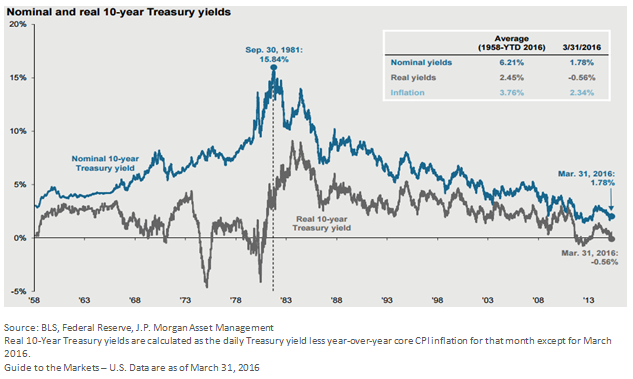
In addition to this global phenomenon, as the chart below illustrates real yields hear in the United States are also turning negative. The last time this happened was during the 1970s when the Fed was trying to check inflation and raising rates.
Complacency and ignorance do not bode well in our industry. Today, we too often read about the “safety” or “relative safety” of bonds and we feel investors have been lead to believe that they will not lose a lot of money in bonds…ever. How will baby-boomers react if they open their statements and see their bond holdings with significantly lower prices? Will the baby boomers, with trillions invested in bonds to fund their retirements, panic if they see bond losses? If so, could this create the selling pressure described above which will subsequently drive prices even lower? We shall see.
Furthermore, many Target Date funds (TDFs) use bonds of all types as the receptacle of “safe” monies, in increasing percentages, as workers get closer to retirement. Perhaps this is part of the reason why the three largest 2010 TDFs each lost 21-27% in 20088. Regardless, could even a modest rise in interest rates start a chain reaction of sorts? How will TDFs perform if the assets are locked into increasing bond positions as participants near retirement? Education is needed and needed soon!
It is almost certain that rates will one day rise substantively. We hope the investing public and our industry is ready to deal with the potential fallout.
- Bogleheads.org
- A History of Bond Market Corrections, Ben Carlson, 5/7/15
- Louis Federal Reserve or FRED
- Louis Federal Reserve or FRED
- How to Predict the Next Decade’s Bond Returns. The Wall Street Journal, March 3, 2014 and Dry Powder, October 15, 2015 by Michael Batnick
- Federal Reserve Bank of New York
- A brief History of Bond Market Disasters, Madisonave.com, August 16, 2012
- Fidelity Investments, Vanguard, T. Rowe Price 2010 Target Date Fund Fact Sheets
Disclosure Information
This material is provided for informational purposes only and should not be taken as investment advice. Any conclusions or assumptions described are to illustrate potential benefits, however are not guaranteed. The information presented is based on data obtained from third party sources. Although it is believed to be accurate, no representation or warranty is made as to its accuracy or completeness.
Past performance is no guarantee of future results. An investment cannot be made directly in an index.
Fixed income securities are subject to credit, inflation and interest risks, among others.
The views and opinions expressed are those of our Portfolio Manager at the time this paper is published. The opinions or outlooks may change over time with changing market conditions or other relevant variables.
The Barclays Capital US Aggregate Bond Index is a market capitalization-weighted index of investment-grade, fixed-rate debt issues, including government, corporate, asset-backed, and mortgage-backed securities, with maturities of at least one year.
Coupon is the amount of interest due and the date on which payment is to be made. Coupon rate is the interest rate on a bond, expressed as a percentage of the bond’s face value. Typically, it is expressed on a semi-annual basis. Yield is the annual percentage rate of return earned on a security. Yield is a function of a security’s purchase price and coupon interest rate. Mortgage-backed bonds are bonds or notes backed by mortgages on residential or commercial properties—an investor is purchasing an interest in pools of loans or other financial assets. As the underlying loans are paid off by the borrowers, the investors in MBS receive payments of interest and principal over time. The MBS market is for institutional investors and is not suitable for individual investors. Treasury bonds are marketable, fixed-interest U.S. government debt securities with a maturity of more than 10 years. Duration is the weighted maturity of a fixed-income investment’s cash flows, used in the estimation of the price sensitivity of fixed-income securities for a given change in interest rates.
All index names of the Barclays indices are trademarks of Barclays Bank PLC.