- Only 20% of all mid-cap growth funds outperformed the S&P MidCap 400 Growth Index, and investors paid an average 1.3% fee on mid-cap growth funds for the that underperformance as well
- In comparison, mid-cap ETFs have an average expense ratio of 0.42%, according to XTF data
- The $3.9 billion ETF holds over 700 stocks, nearly 22% of which are financial services names
Stock-picking is difficult and plenty of data support that assertion. It can be said that the task is even more difficult with smaller stocks, explaining why so many active managers of small-cap funds lag their benchmarks.
Over the one-year period, mid- and small-cap growth funds were especially poor performers. For instance, only 20% of all mid-cap growth funds outperformed the S&P MidCap 400 Growth Index, and investors paid an average 1.3% fee on mid-cap growth funds for the that underperformance as well. In comparison, mid-cap ETFs have an average expense ratio of 0.42%, according to XTF data.
“On an equal-weighted basis, the average mid-cap growth fund returned -1.23% and lagged by 328 basis points in 2015, much higher than the expense ratio incurred,” Rosenbluth said. “This suggests to us that unwarranted stock selections contributed to underperformance.”
Additionally, just 12% of all small-cap growth funds outperformed the S&P SmallCap 600 Index. Funds that track larger companies fared slightly better, with 51% of all large-cap growth funds outperforming the S&P 500 Growth index.
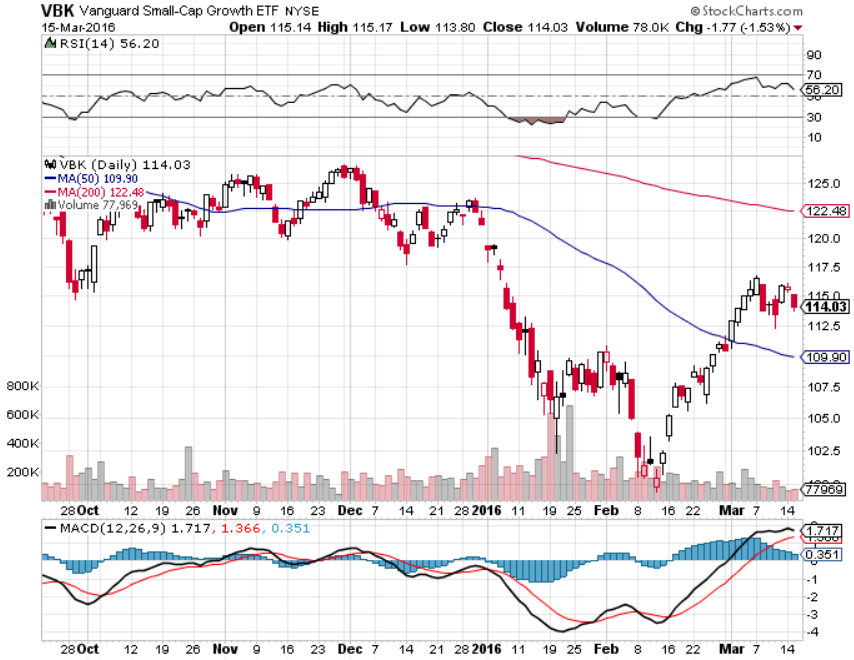
The Vanguard Small-Cap Growth ETF (NYSEArca: VBK) is a cost-effective option for investors looking for a passive approach to small-cap growth stocks. Compared to an actively managed small-cap fund, VBK is cheap. Well, compared to almost any fund, VBK is cheap as it charges just 0.09% per year, or $9 for every $10,000 invested. That is less expensive than 93% of rival funds, according to Vanguard.
The $3.9 billion ETF holds over 700 stocks, nearly 22% of which are financial services names. Industrials and technology stocks combine for over 34% of VBK’s weight. VBK follows the CRSP US Small Cap Growth Index.
“CRSP classifies growth securities using the following factors: future long-term growth in earnings per share (EPS), future short-term growth in EPS, 3-year historical growth in EPS, 3-year historical growth in sales per share, current investment-to-assets ratio, and return on assets,” according to a Seeking Alpha analysis of VBK.
Cyclical stocks, like materials, industrials, energy and technology companies, are more economically sensitive and do well when the economy is improving. With the Federal Reserve set to hike rates, the rising rate environment would signal a better economic outlook.
Cyclical sectors, which are heavily represented in VBK, currently trade at a discount to the broader market. In addition to its large combined weight to industrial and technology stocks, consumer discretionary names command over 15.5% of VBK’s weight.
Vanguard Small-Cap Growth ETF