
Applying Momentum
Our tool of choice for creating an investment strategy to benefit from the business cycle will be momentum. Broadly defined, momentum investing is the process of investing in securities that have outperformed their peers over a recent time frame in hope that they will continue to do so. We extensively covered momentum in a previous paper titled “Is Momentum a Viable Strategy? Yes, but not the way you think”4 and recommend reading that as a starting point if you would like more information on the topic. Our basic premise behind this strategy is presented below:
- Certain sectors will perform relatively better than others during different stages of the business cycle.
- A momentum strategy, in this case using a moving average, can help us identify which sectors are more likely to realize positive performance going forward.
Our expectation is that a moving average strategy, which uses market data, may help us to determine which sectors are actually doing well during each portion of the business cycle. This could allow investors to benefit from the business cycle without requiring the sectors that have historically performed well during certain stages of the business cycle to do so in the future. To illustrate this point, we tested a hypothetical momentum-based strategy that would have held, in equal weight, any of the nine GICS-defined sectors of the S&P 500 that were trading above their 200-day moving average, a common metric of strength that we used as a proxy for momentum. For comparison, we also tested a hypothetical fundamental portfolio in which we took a backward-looking approach by fitting the last twenty-five years5 into one of the four cycles. Owning only the sectors which have historically outperformed the average6 in each particular cycle. Under this methodology the fundamental portfolio would have remained fully invested throughout the test period, but we recognize that this is an unfair knock on the economist. After all, we would expect the world’s best economist to know that none of the S&P’s nine sectors have achieved a positive return across our test period during recessions. Therefore, we will assume our test fundamental portfolio went to 100% cash during recessions.
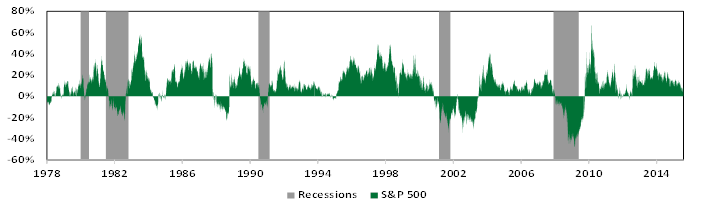
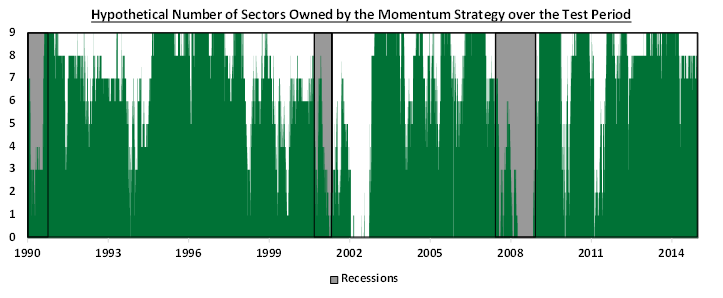
On the chart above, each point represents the annualized trailing 3-year return for the test momentum and fundamental sector rotation strategies compared to that of the S&P 500. It is important to note that the analysis above does not take any expenses, taxes, management fees, or trading costs (the momentum strategy averaged roughly 69 trades per year) into account, and therefore likely overstates returns. It appears as though the test momentum-based strategy managed to mimic the results of our handpicked test fundamental strategy relatively closely across the test period. To further examine why this was the case, we examined the average holdings of the momentum-based strategy during recessionary periods in the chart to the left. The highlighted sectors are the ones which historically outperform their peers during recessions. Outside of the Materials and Energy sector, which remained in the momentum model longer during the 2007-2008 recession due to strong performance in the prior late cycle, the allocation is fairly harmonious with the fundamentals. However, by using momentum to identify when a sector “fails”, the momentum model has significantly more flexibility in raising cash and can hold on to or get back into defensive sectors when beneficial during a recession. This difference is glaring when looking at the early 2000s tech bubble when the S&P 500 failed as a leading indicator. After the official end of the recession it declined an additional 27%. The fundamental model was forced to suffer through this, while the momentum model could react defensively and raise cash outside of an official recession.
This flexibility is incredibly important because in addition to the inherent delay of a fundamentally-driven business cycle strategy, the fundamental strategy also assumes that the relationships between certain sectors and certain stages of the business cycle, which existed in the past, will continue to exist in the future. It is logical to believe that businesses providing necessary goods will perform better on a relative basis when times are bad, and businesses providing desired goods will perform better on a relative basis when times are good. However, businesses and economies evolve.
As technology progresses and businesses adapt accordingly, the composition of sectors may become increasingly blurred. For example, is the ride-sharing phenomenon UBER, a transportation company, placing it in the industrials sector, or should its heavy dependence on technology and low overhead place it in the Technology sector? What about Amazon? Is the online retailer more comparable to a consumer discretionary company, a consumer staples company, or a technology company? While it currently resides in the Technology sector, it’s clear that a case could be made for all three. In addition, the effects of globalization further complicate how we define the business cycle as companies increasingly derive more of their sales outside of the United States. In the four sectors which generated over 50% of 2014 sales outside the US8 do we need a full assessment of the international business cycle as well to determine how they will be affected?
We don’t have the answers to these questions, but by taking advantage of a market phenomenon such as momentum, we can react to the changing market fundamentals without the impossible burden of predicting them.
Brendan Ryan and Denis Rezendes are each Research Analysts at Beaumont Capital Partners, a participant in the ETF Strategist Channel.
Disclosures:
Copyright © 2015 Beaumont Financial Partners, LLC. All rights reserved.
-
Includes equity market returns from 1962 through 2010. Returns are represented by the top 3000 U.S. stocks ranked by market capitalization. Sectors as defined by GICS. Source: Fidelity Investments (AART) as of Apr. 30, 2012. Early Cycle: Above average acceleration in economic activity. Macroeconomic variables rebound from previous contractionary phase; Mid Cycle: Rate of growth in economy is positive but not increasing at the rate of the previous Early-Cycle phase. Overall growth is peaking and economy is generally healthy; Late Cycle: Growth remains positive but is slowing, inflationary pressures begin to build; Recession: Contraction in economic activity, profits decline and credit is not readily available.
-
National Bureau of Economic Research business cycle peak and trough dates: US Business Cycle Expansions and Contractions. (2010, September 20). Retrieved August 19, 2015, from http://www.nber.org/cycles.html
S&P 500 peak and trough dates were determined using the S&P 500 Total Return Index produced by Standard & Poor’s Financial Services LLC.
-
S&P 500 Index returns retrieved from Bloomberg. Recession dates retrieved from the National Bureau of Economic Research, as cited in endnote number three. 1-Year rolling return was calculated as the 252 trading days preceding each date.
-
Rezendes, D., & Ryan, B. (2015). Is Momentum a Viable Investment Strategy? Yes, but not the way you think. Beaumont Capital Management. Please contact [email protected] to request a copy of this paper.
-
Global Industry Classification Standard (GICS) taxonomy is utilized in the construction of the Standard & Poor’s sector indices. Classification for United States corporations begin in 1989 and as a result sector index data is only available in periods following 1989.
-
Composition of fundamental strategy in each stage is an equal weighted portfolio of the following sectors. Early Cycle: Materials, Technology, Financials, Consumer Discretionary, and Industrials; Mid Cycle: Technology, Healthcare, Financials, Energy, and Industrials; Late Cycle: Materials, Healthcare, Consumer Staples, Utilities, Energy; Recession: No sectors held.