
The chart below contrasts the ROE trend of the excellent-performing healthcare sector with financials. Before the financial crisis, the two industries produced similar levels of profitability. Because financial firms were at the epicenter of the crisis, their profits fell the most. In 2010, financial firms rallied both in profitability and performance. Since then, financial ROEs have stalled out well short of previous levels. While healthcare stocks fell during the crisis, their ROEs held up very well and remain at high levels. The performance shows healthcare has been rewarded, outperforming financials from 2011-2015 (with the exception of 2012).
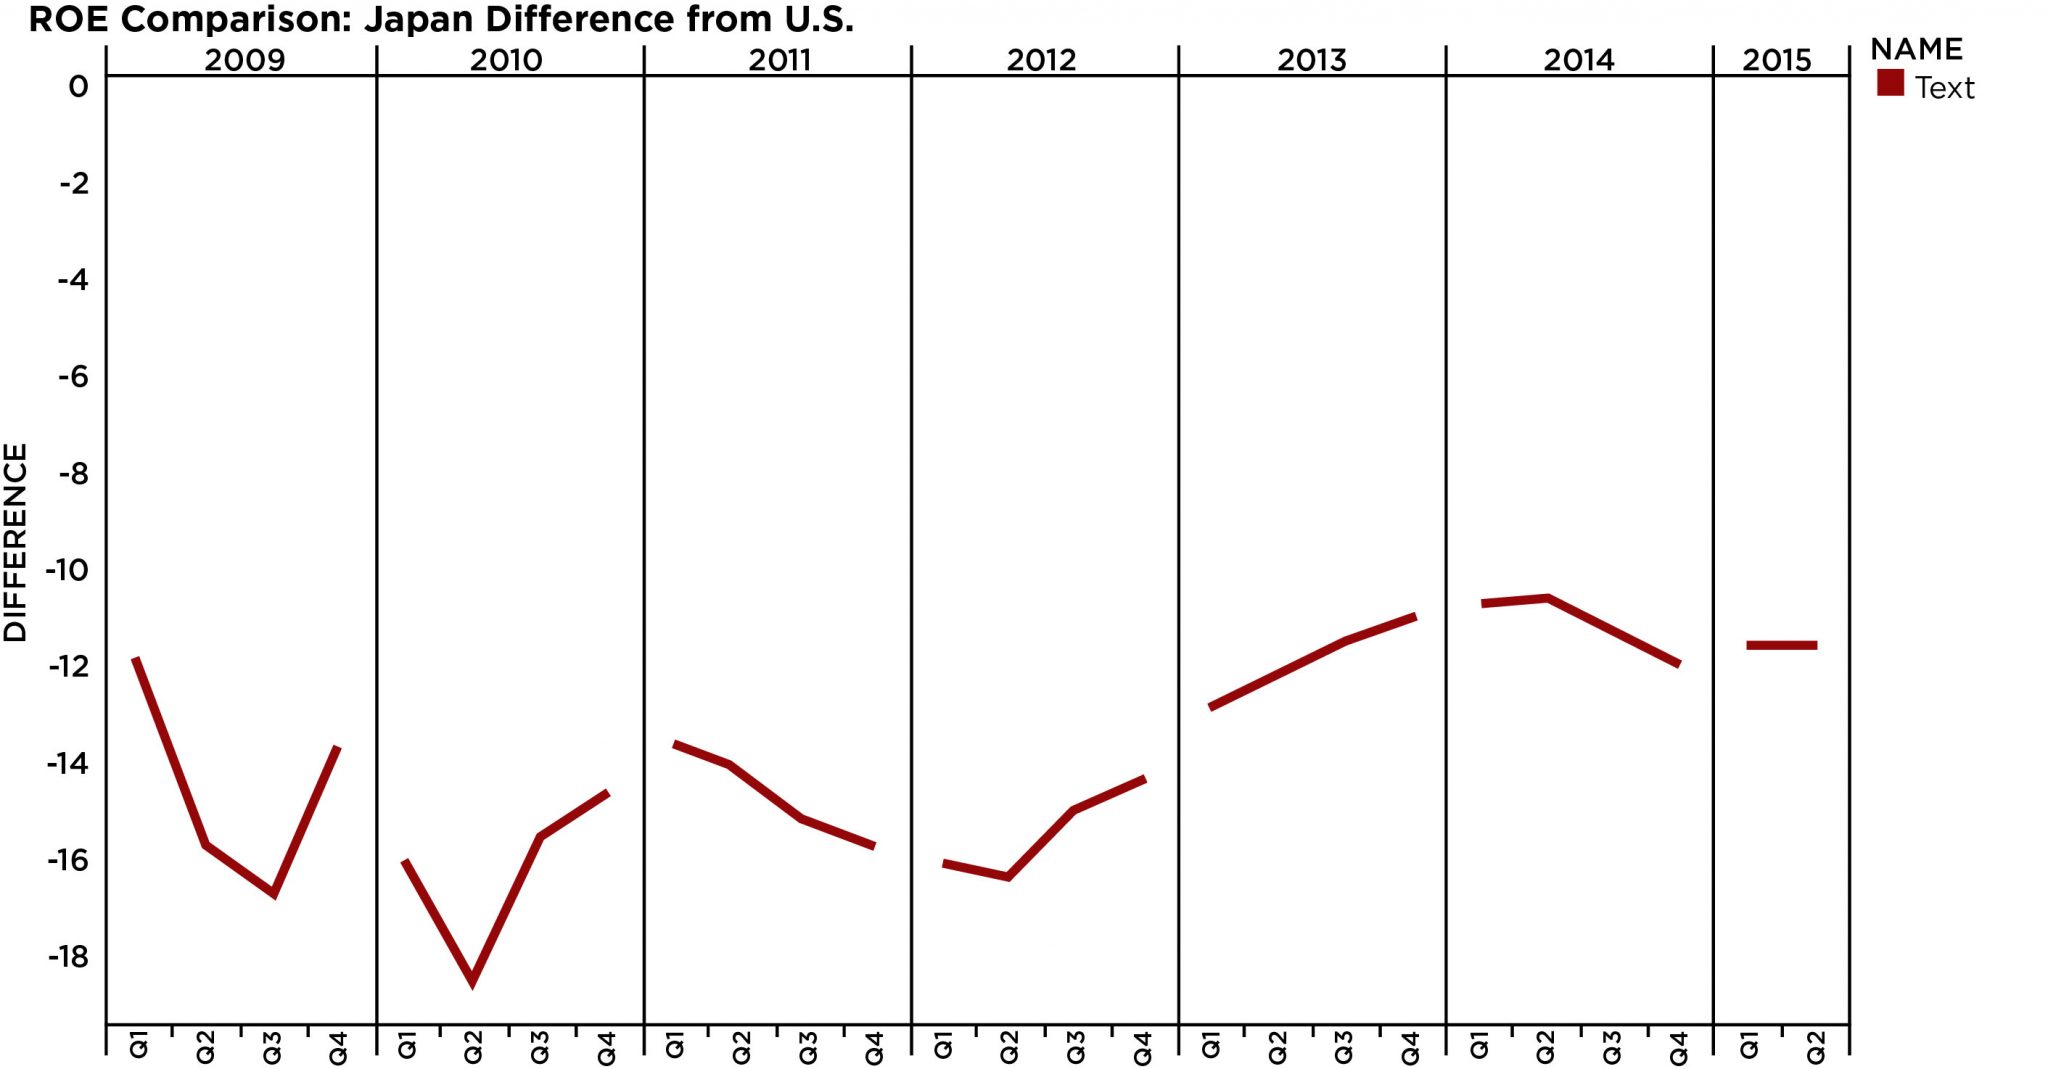
The Rising Sun and the Shooting Star
The last chart shows another important point to consider when analyzing ROE: improvement matters. The chart subtracts the ROE of the U.S. stock market from the Japanese market. The first thing to note is the numbers are very negative. This means Japan’s ROE level has remained very low compared to the U.S. However, the Japanese government’s reform program includes efforts to improve corporate efficiency, and steady changes by Japanese firms have pushed the ROE higher in recent years. Investors have taken notice. Excluding swings in the exchange rate, Japanese stocks have outperformed the S&P 500 in 2012, 2014, and year-to-date.
While global growth continues to lag, some asset classes, sectors, and countries have produced excellent performance for investors. And in this environment, it’s helpful to understand ROE trends and utilize this data to evaluate investment opportunities. Our research shows many of the strong performers are firms that have historically produced high returns on their equity investments or those that are able to make improvements from low levels.
Scott Kubie is the Chief Strategist at CLS Investments, which is a participant in the ETF Strategist Channel.