Uranium stocks and the Global X Uranium ETF (NYSEArca: URA), which tracks uranium miners, have been a more than four-year slump since the 2011 Fukushima disaster in Japan. That slumped continued in 2015 as highlighted by URA’s nearly 39% year-to-date tumble.
With 2016 nearly here, URA heads into another new year with some bullish forecasts. The question is whether or not next year will bring different, more positive outcomes for the ETF and uranium stocks than the past several years.
Earlier this year, URA and its components got a modest lift after the Kogoshima District Court rejected a legal bid to block the reopening of the Sendai nuclear power station due to safety concerns on Wednesday, reports Kentaro Hamada for Reuters.
The Sendai plant will be the first to reopen since Japanese nuclear stations were shutdown in response to the devastating earthquake and subsequent disaster in Fukushima. The reactors could begin operation as early as June.
In response to the fallout, anti-nuclear activists have aggressively petitioned courts to block restarting the plants. Nevertheless, the court’s response may reflect more favorable opinions in some areas. [Good News for the Uranium ETF]
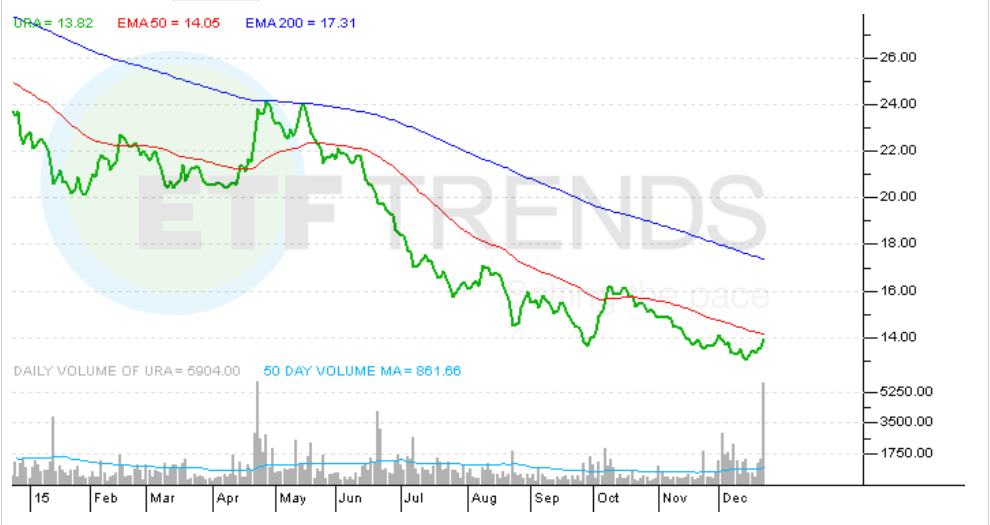
“From a structural perspective, there have been few things worse than URA these past few years. It is down roughly 90% off of its 2011 highs and needs to reverse split occasionally just to remain trading. With that being said, my structural downside target at the 261.8% extension of the January – May 2015 rally was met this past August. More recently, the Uranium ETF retested the year-to-date lows, momentum diverged positively, and prices are now attempting a breakout above the accelerated downtrend line that’s been intact since May,” according to See It Market.
With nuclear energy industry looking brighter, uranium demand is expected to rise. According to the World Nuclear Association, the number of new nuclear plants due to go online this year and in the next three years is expected to total around 40, and more are planned in the years ahead, mostly in Asia, writes Lawrence Williams for Mineweb.
“If this breakout can hold, the first target seems obvious at the downtrend line from the August highs near 15.25, which corresponds nicely with the longer term downtrend line on the weekly chart. Above that, there is prior support near 17, which also represents the 38.2% retracement of the May-December decline and the area of the downward sloping 200 day moving average. That is the ultimate price target for the Uranium ETF if the rally continues to develop over the next few weeks and months,” adds See It Market.
Global X Uranium ETF