The SPDR S&P Retail ETF (NYSEArca: XRT) has lagged broader benchmarks this year, slumping more than 6% over the past month. That performance could spell trouble for XRT and rival retail exchange traded funds because this is the time of year these funds typically rise.
Morgan Stanley projects a 1.2% growth in sales this year, compared to 2.8% the previous year. Rivals to XRT include the Market Vectors Retail ETF (NYSEArca: RTH) and the PowerShares Dynamic Retail Portfolio (NYSEArca: PMR).
RTH covers the 25 largest U.S. companies involved in retail distribution, wholesalers, on-line, direct mail and TV retailers, multi-line retailers, specialty retailers and food and other staples retailers. Top components include Amazon (NasdaqGS: AMZN), Home Depot (NYSE: HD) and Wal-Mart (NYSE: WMT).
XRT “peaked relative to the market in April although its chart shows a trading range in the first half of the year (see Chart 1). It fell with the market over the summer, but unlike the Standard & Poor’s 500 its chart did not show much of a September-October rally. Recall that the S&P 500 put together a six-week winning streak that ended with last week’s pullback. The index came very close to wiping out its entire summer swoon,” reports Michael Kahn for Barron’s.
PMR follows a factor-based index, which weights components based on price momentum, earnings momentum, quality, management action and value. Top holdings include O’Reilly Automotives (NasdaqGS: ORLY), L Brands (NYSE: LB) and Costco Wholesale (NasdaqGS: COST).
The Commerce Department calculated that retail sales was up 0.1% last month, compared to economists’ forecasts for an increase of 0.3%, after being unchanged in September. [America’s Less Dressed: 3 Factors Weighing On Retail ETFs]
While many expected cheap gasoline prices to translate into increased spending, the weak sales report suggests that the savings are being used to pay for other necessities, such as higher rents.
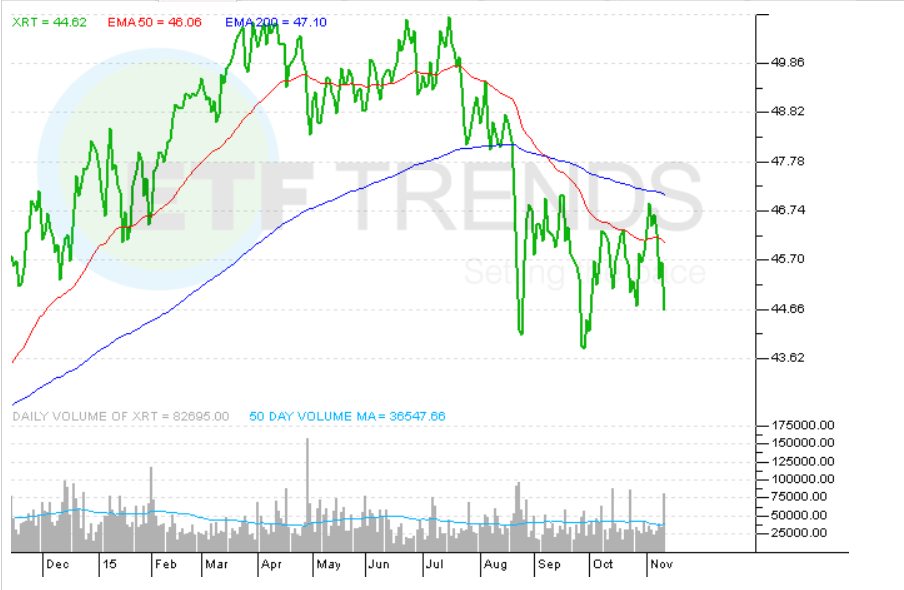
“Retail was not so lucky. With very little cushion below it, the retail ETF fell below support at its September low to levels not seen since the Aug. 24 mini-flash crash. It is solidly below its 50- and 200-day moving averages and arguably below the rising trendline drawn from its 2008 bottom,” according to Barron’s.
SPDR S&P Retail ETF